explorEDA
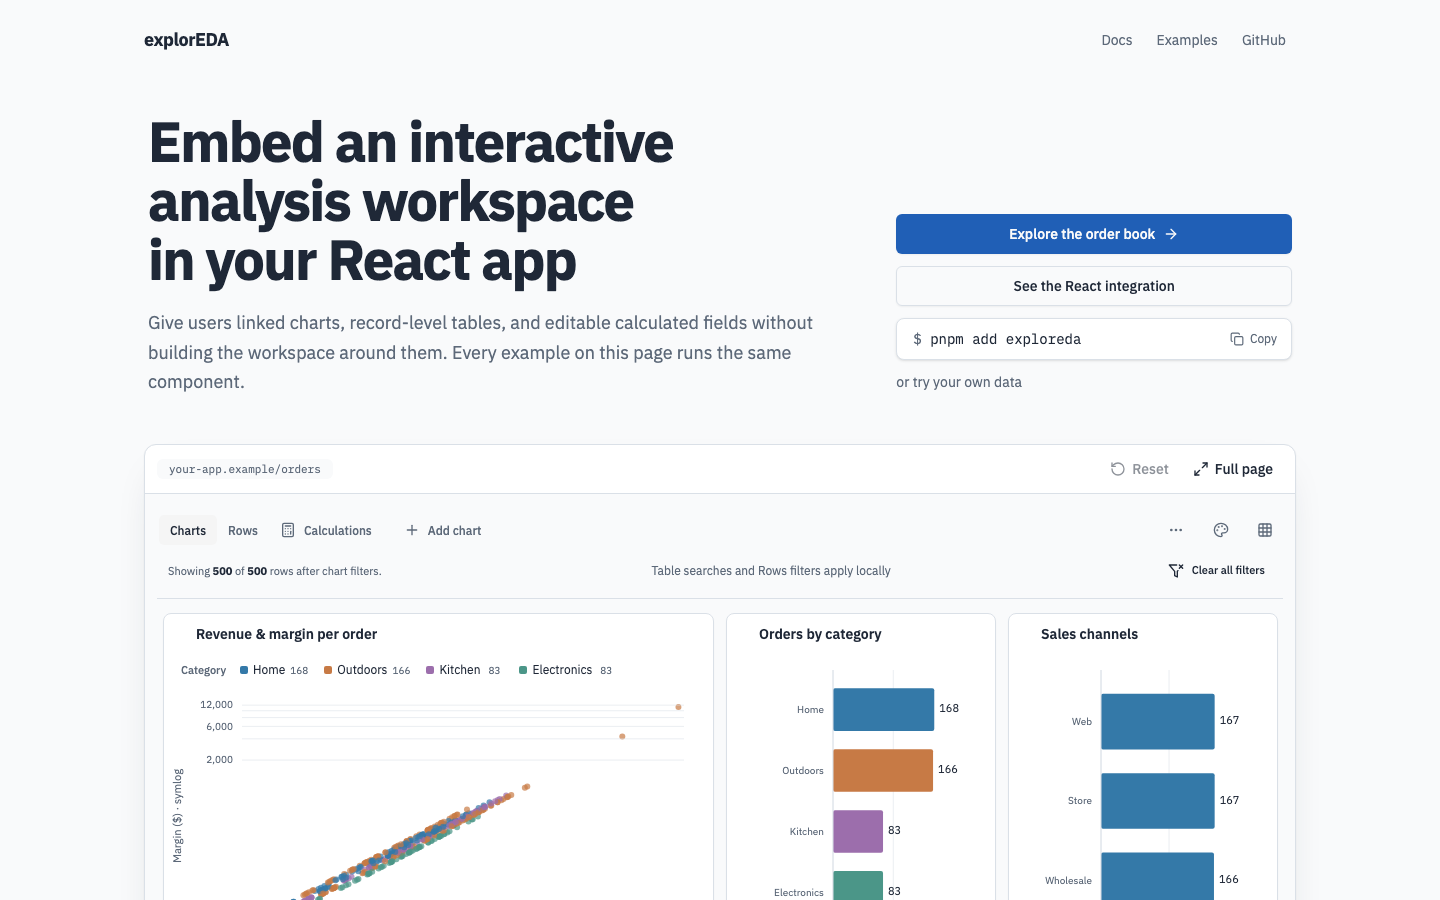
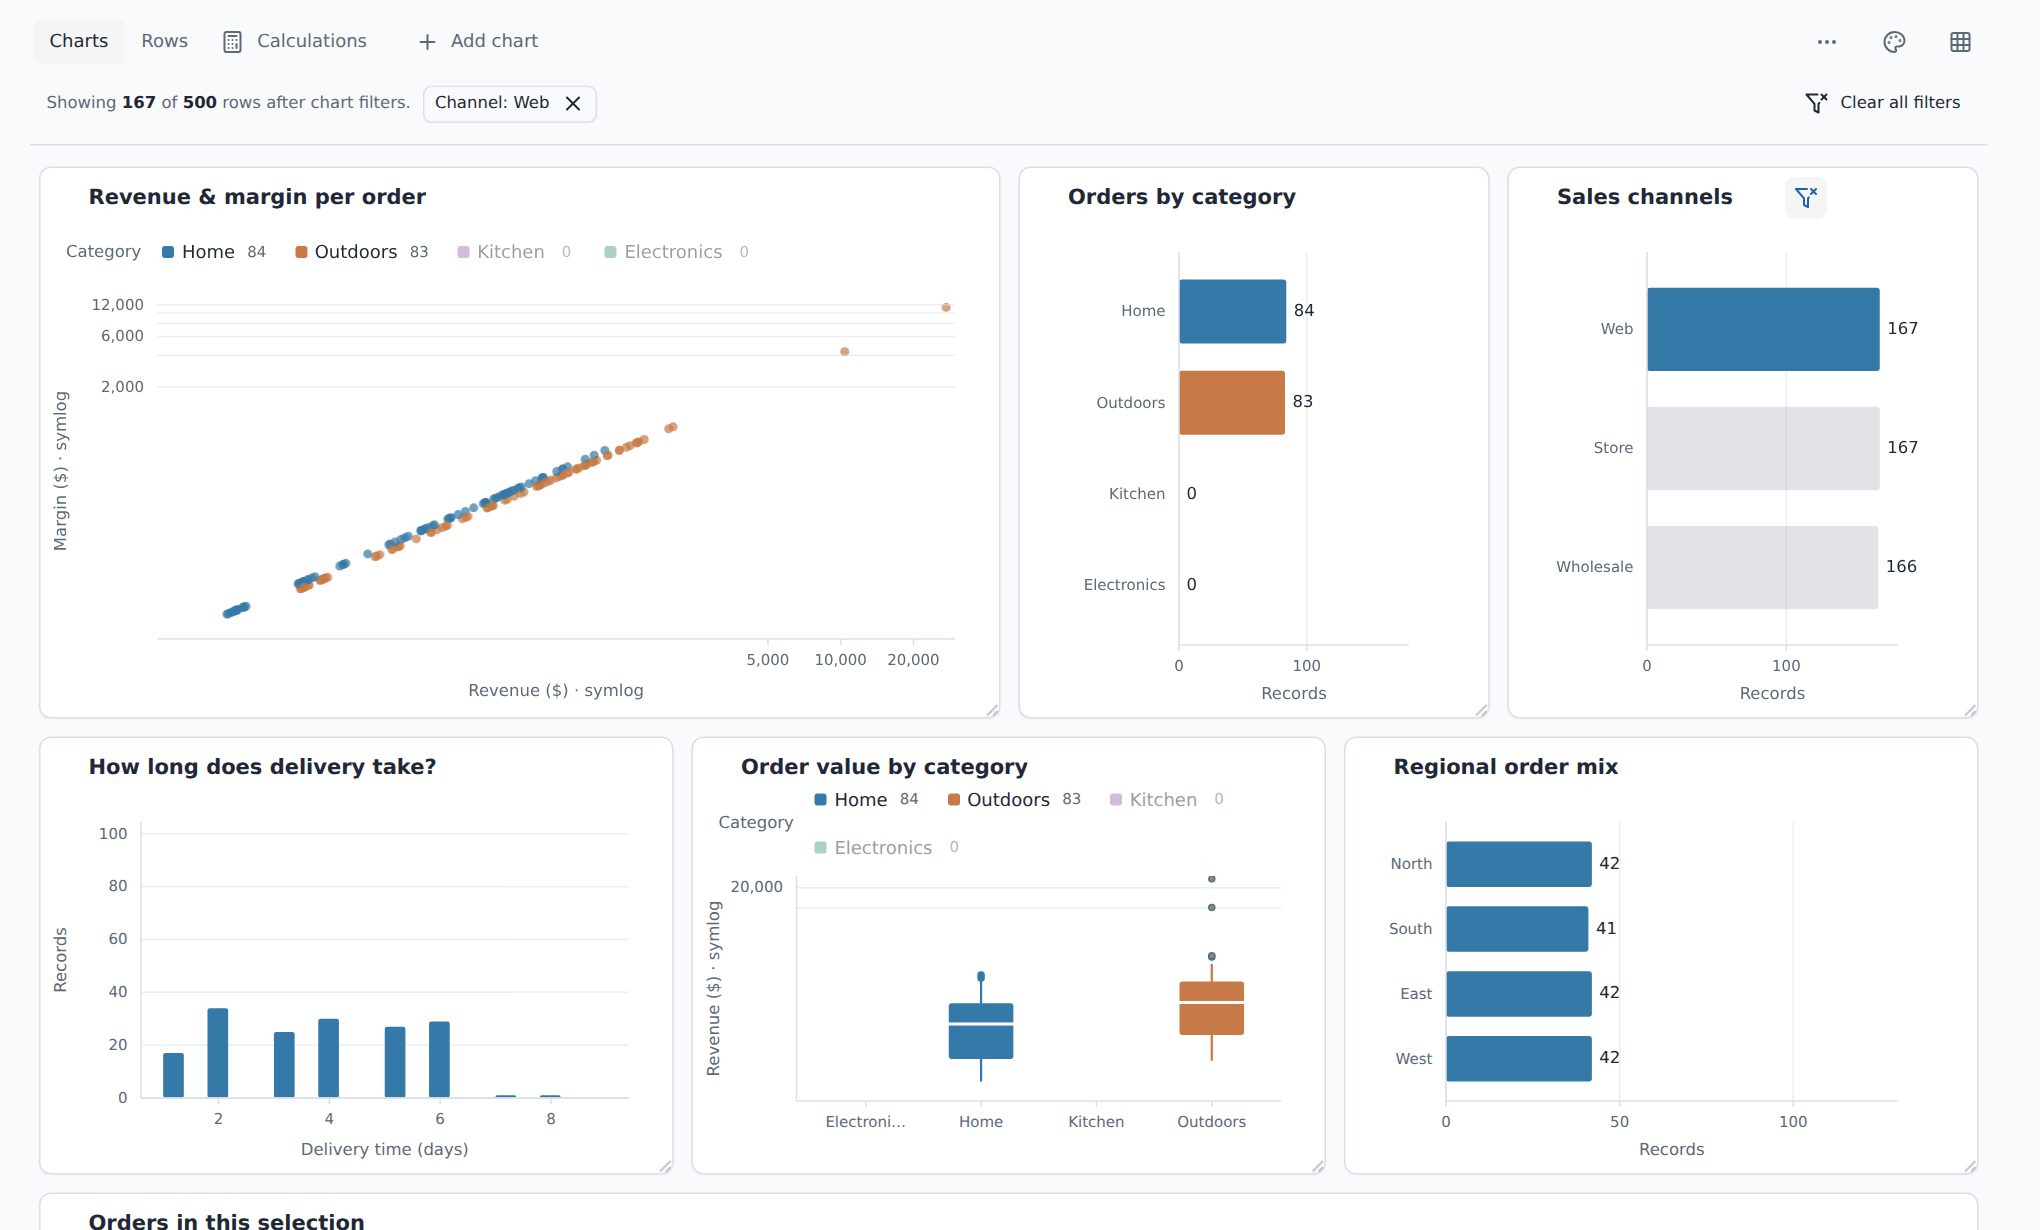
explorEDA is a React package for exploratory data analysis. You pass it rows, and it gives you a workspace of charts that share one filter state. Select bars or brush a scatter plot, and every other chart recomputes against the remaining rows. A record table then shows the rows behind the pattern.
- Try it: exploreda.dev
- Install:
pnpm add exploreda - Source: byronwall/explorEDA
Identity

The icon uses a three-by-three data grid with one selected cell. The icon and wordmark also work as separate SVG assets.
Interface
How it works
The whole workspace is one component, ExplorEda, with three props at the host boundary:
data: the rows your app supplies. Pass a new array when the rows change; in-place mutations are not observed.savedData: optional settings that restore charts, calculations, row filters, and layout. The raw rows are not included.onStateChange: called after meaningful edits with JSON settings. Your app decides where to keep them.
Inside the component:
- Shared filtering: Crossfilter holds the rows and filter state, so a selection in one view narrows all the others.
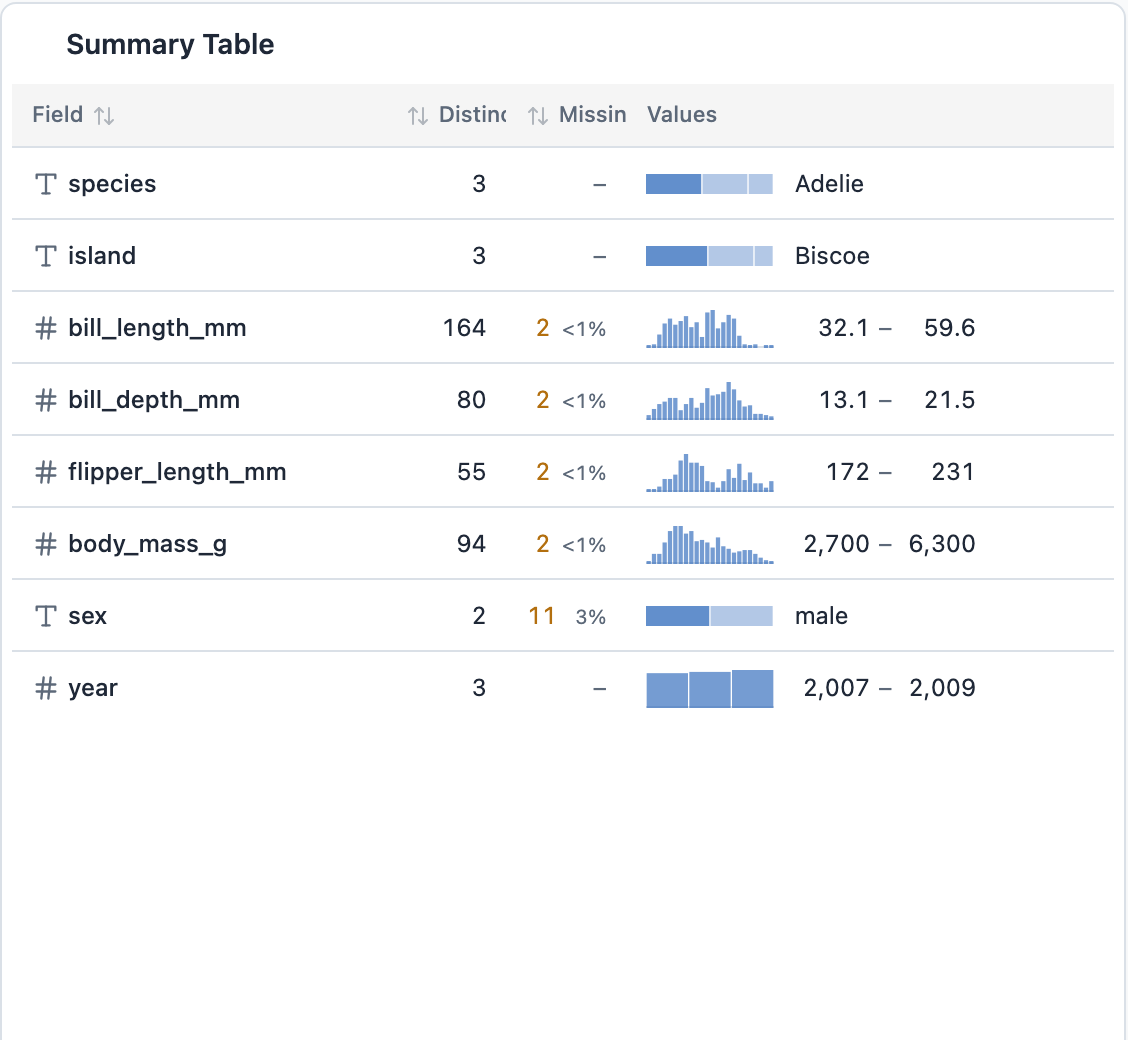
- Charts: the chart types are row, bar, line, scatter, 3D scatter, box plot, pivot table, data table, summary table, markdown, and color legend. They use D3 scales, and the 3D scatter is rendered with three.js.
- Calculated fields: formulas are parsed with an Ohm grammar. Users can inspect their dependency chains and preview a draft before it applies across views.
- Layout: charts sit in a resizable grid, and the arrangement is part of the saved settings.
Highlights
- Linked views plus the record table behind every selection
- Calculated fields whose dependency chains users can inspect
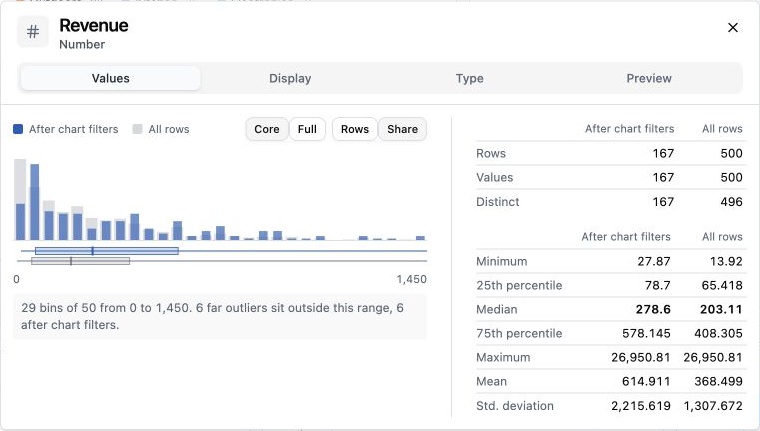
- A summary table with inline histograms, share bars, and missing counts for each field
- Tracing a scatter point from raw values through calculations, filters, and scales to its final position
- Saved settings as typed JSON that the host app owns
- A desktop workspace for viewports of 1024 CSS pixels or more
Overview
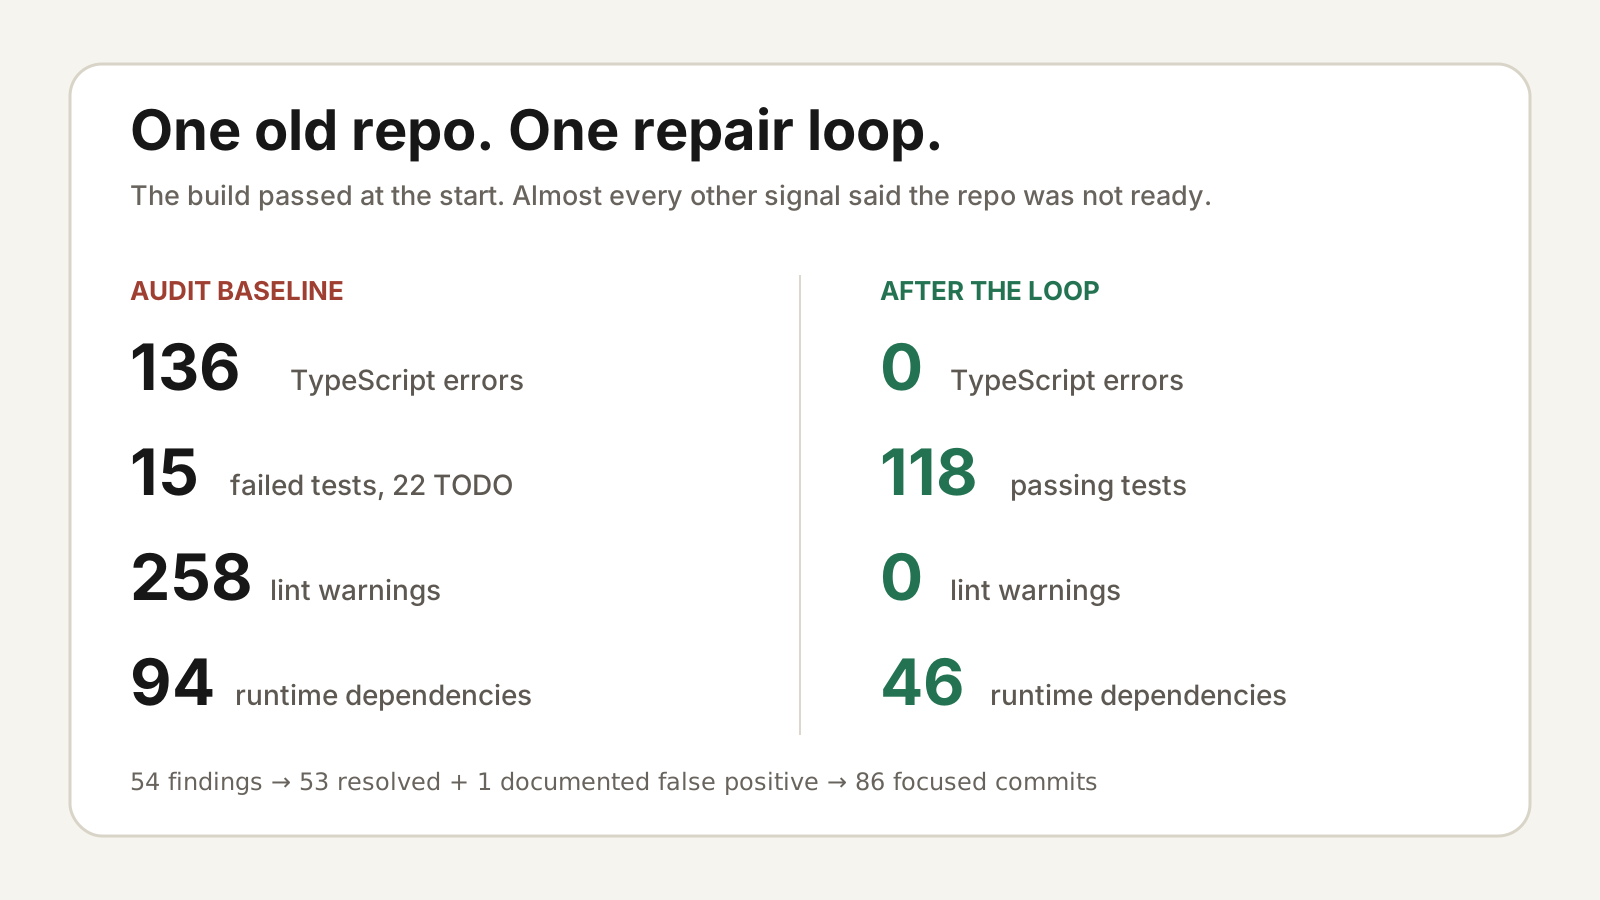
explorEDA started as a two-week sprint in early 2025 and then sat untouched. In September 2026 I reopened it with an audit, repaired the library and demo, and started building it out again. That included a new public landing page on its own domain.