Srcly ranks files and functions by metrics: complexity, nesting, parameter count, any usage, TODOs and a dozen TSX-specific counts. A hotspot list is only useful if you believe the numbers. Until now, a number was all you got. Explorer.tsx has nesting 9. Which nine levels? You had to read the function and count braces yourself.
The change is simple to describe. In the code viewer, click a metric and every line behind its count gets marked in the code, with a short note on why: if, &&, depth 5, 3 params, ×3.
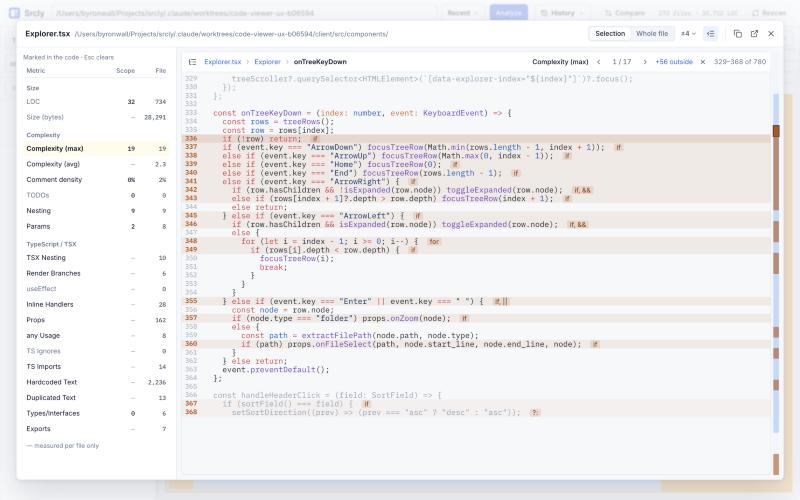
onTreeKeyDown. Each marked line names what it added, and the ruler on the right shows every hit in the file.A ruler beside the code shows every hit. [ and ] step through them. +N outside widens from the current function to the whole file. Comment density is marked in blue instead of the warm color, because more comments is good.
How the markers stay honest
The tempting way to build this is a second pass that re-finds if statements and && operators in the client. That would give you two implementations of every metric, and they would drift apart.
Instead, the overlay comes from the same analyzer that computes the metric. Each counter in the TS/TSX and Python analyzers has a _mark(...) call next to it. A new endpoint, /api/files/markers, runs the analyzer on one file with a marker sink attached. Normal scans never attach one, so they don't pay for it. A test checks that each metric's marker count matches the metric's value, and AGENTS.md now tells anyone adding a metric to call _mark. If the overlay disagrees with the number, one of them is wrong, and that test catches it.
The first thing it caught
Once nesting was on screen, it was obviously wrong:
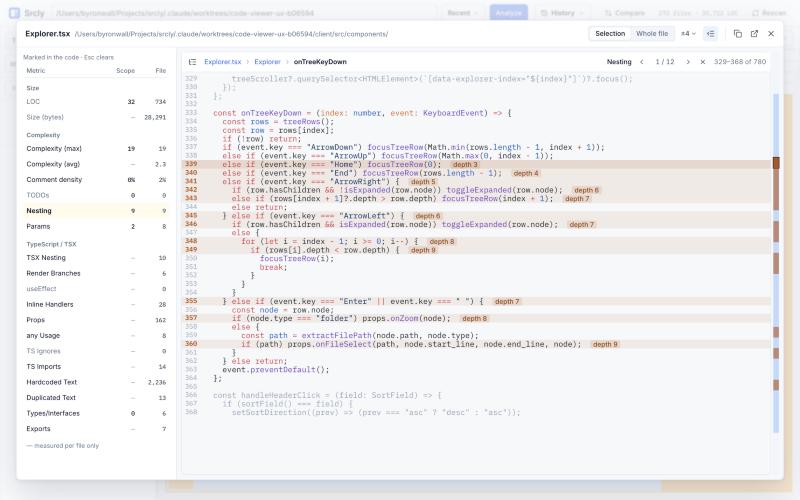
else if lines marked depth 3, depth 4, depth 5… at the same indentation.A key handler written as a flat else if chain shouldn't get deeper with every branch. The cause is in how tree-sitter parses TypeScript. else if is an if_statement nested inside the previous if's else_clause. The analyzer added a level for every if_statement, so each branch counted one level deeper than the one before it.
The fix: an if_statement whose parent is an else_clause doesn't add a level. Real nesting still counts, including an if inside a braced else { } block. Cyclomatic complexity doesn't change, because every else if is still a branch. Python was already right, because elif is its own elif_clause node. New tests cover both languages so it stays that way.
onTreeKeyDown went from nesting 9 to 4, with complexity still 19. Every file with a long else if chain moves down the hotspot list, which is the point. The number had been ranking a writing style, not actual nesting.
That bug had been there through every treemap and hotspot list Srcly has ever drawn. It went unnoticed because a 9 looks like a plausible number. It took seeing the lines to make it look wrong.
Not showing measurements that don't exist
The metrics panel had a quieter version of the same problem. Opening a Python function showed two 22-row lists, including useEffect 0, Props 0 and Markdown counts.
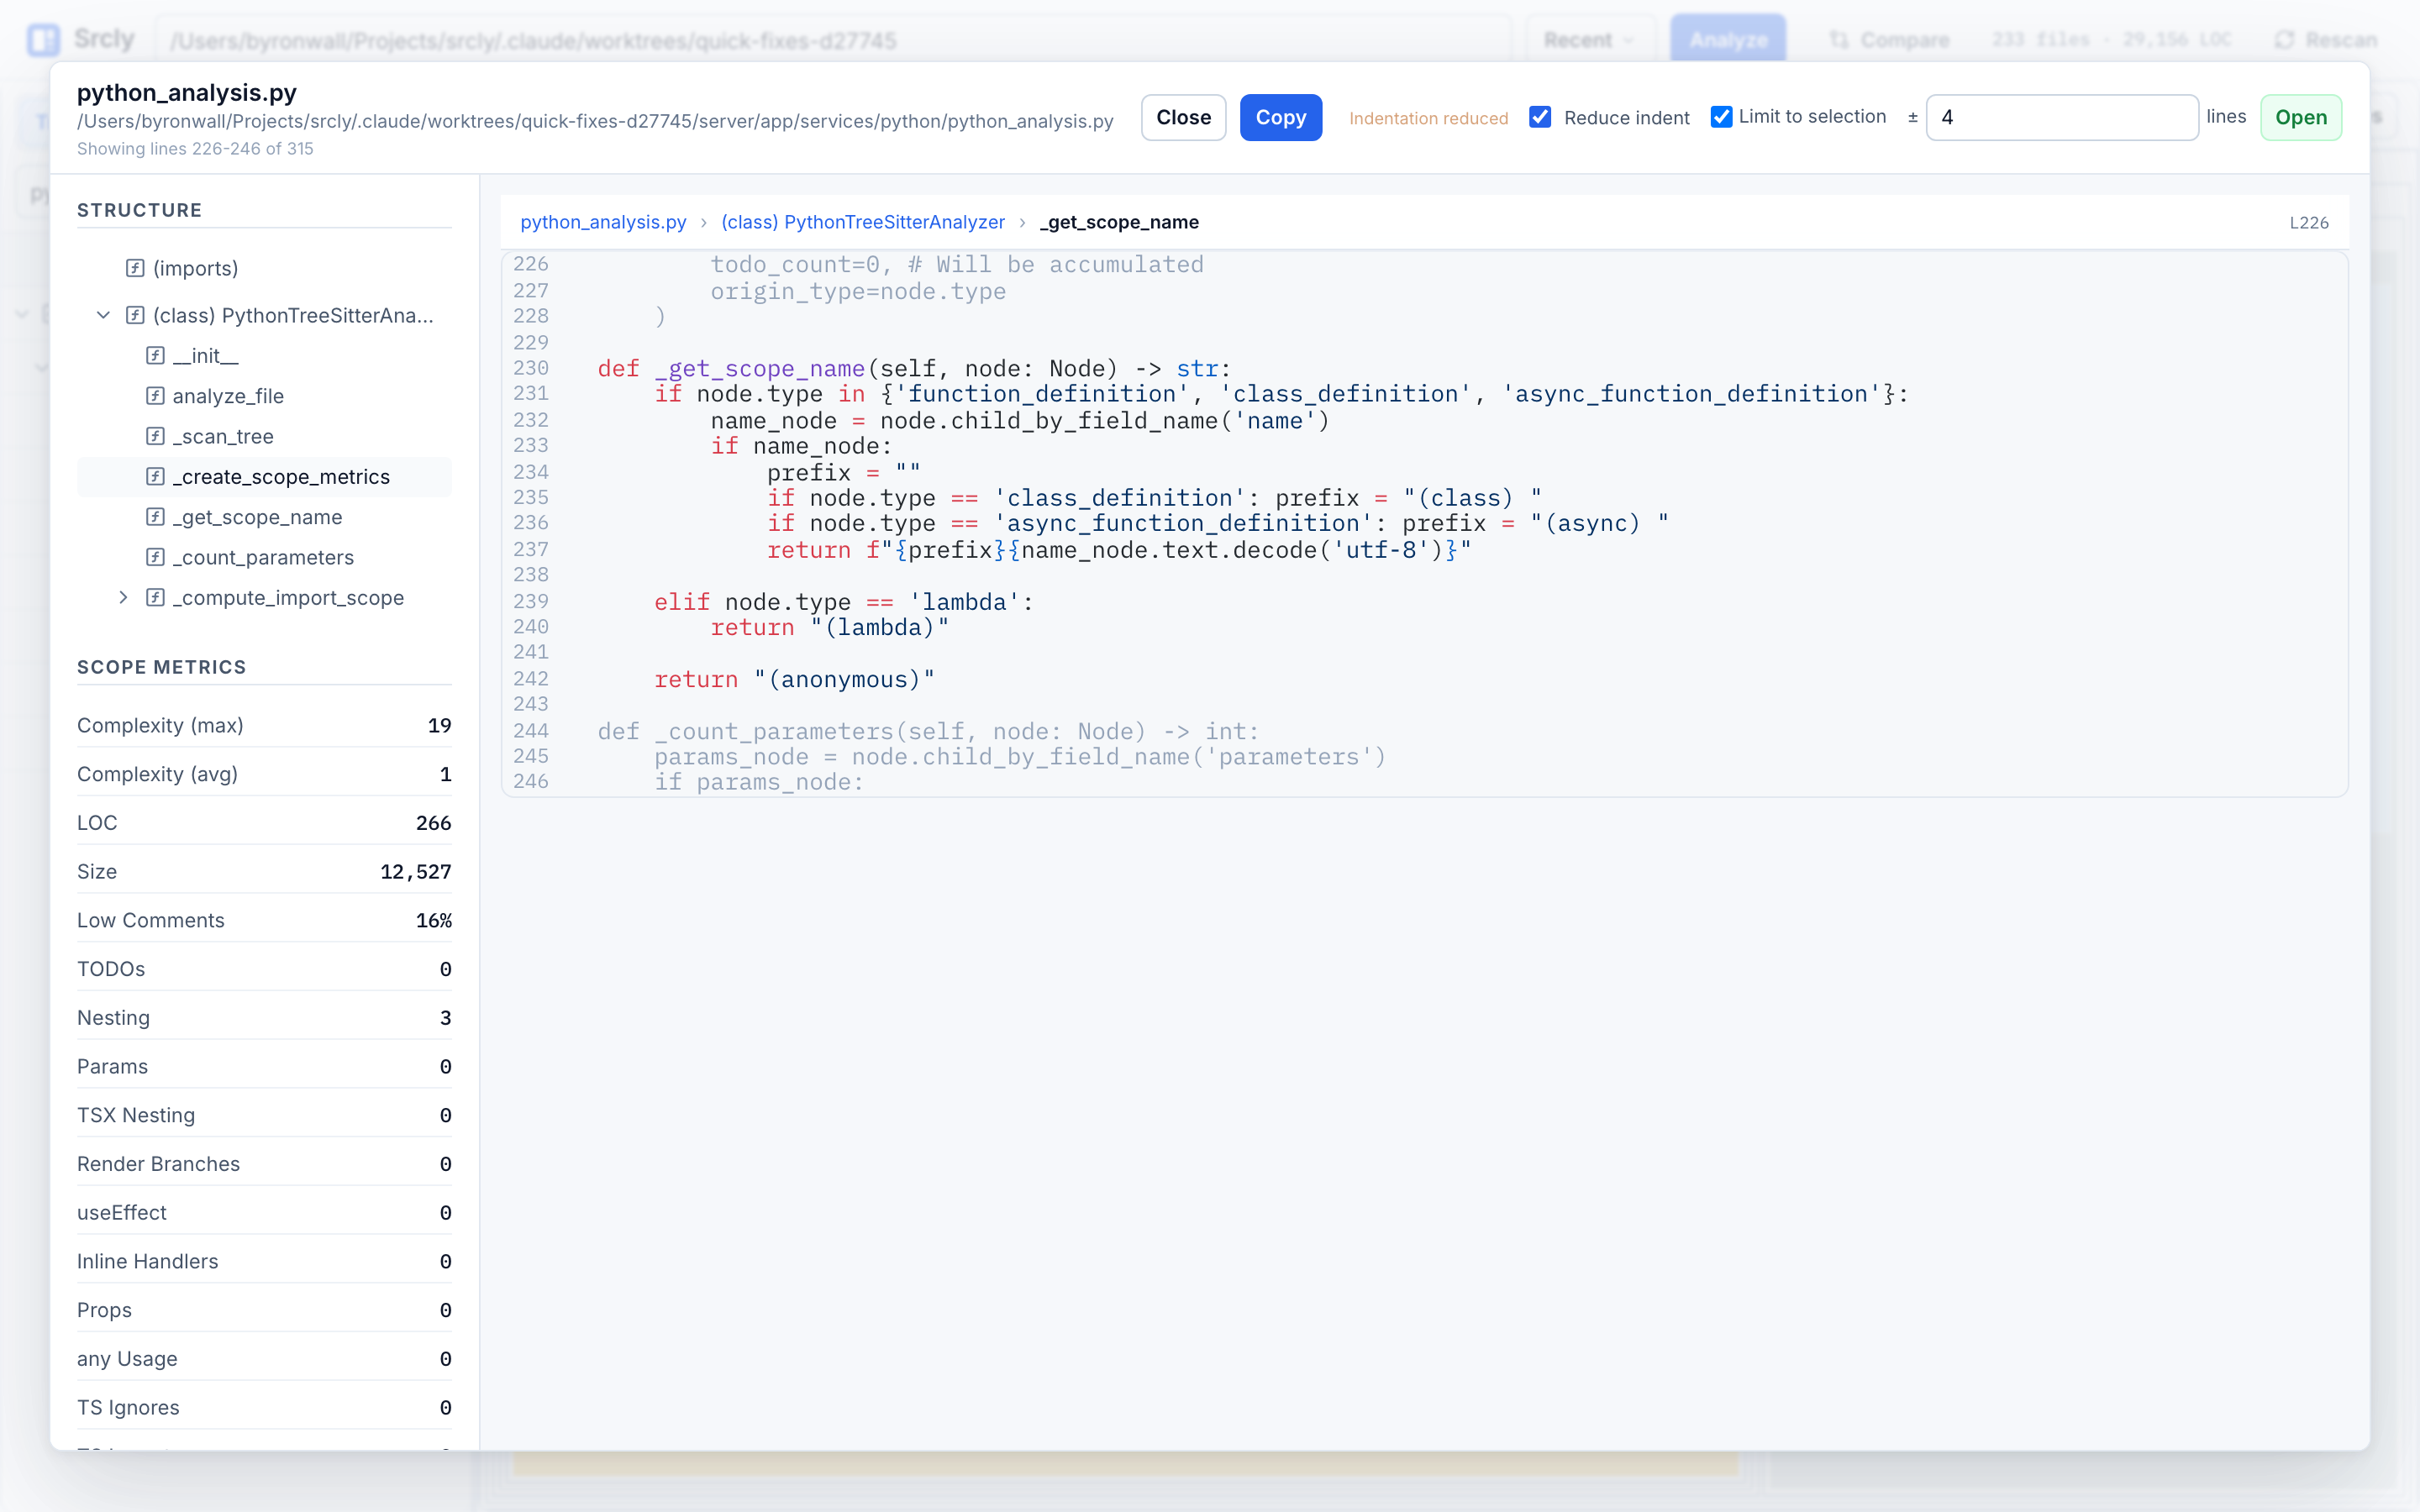
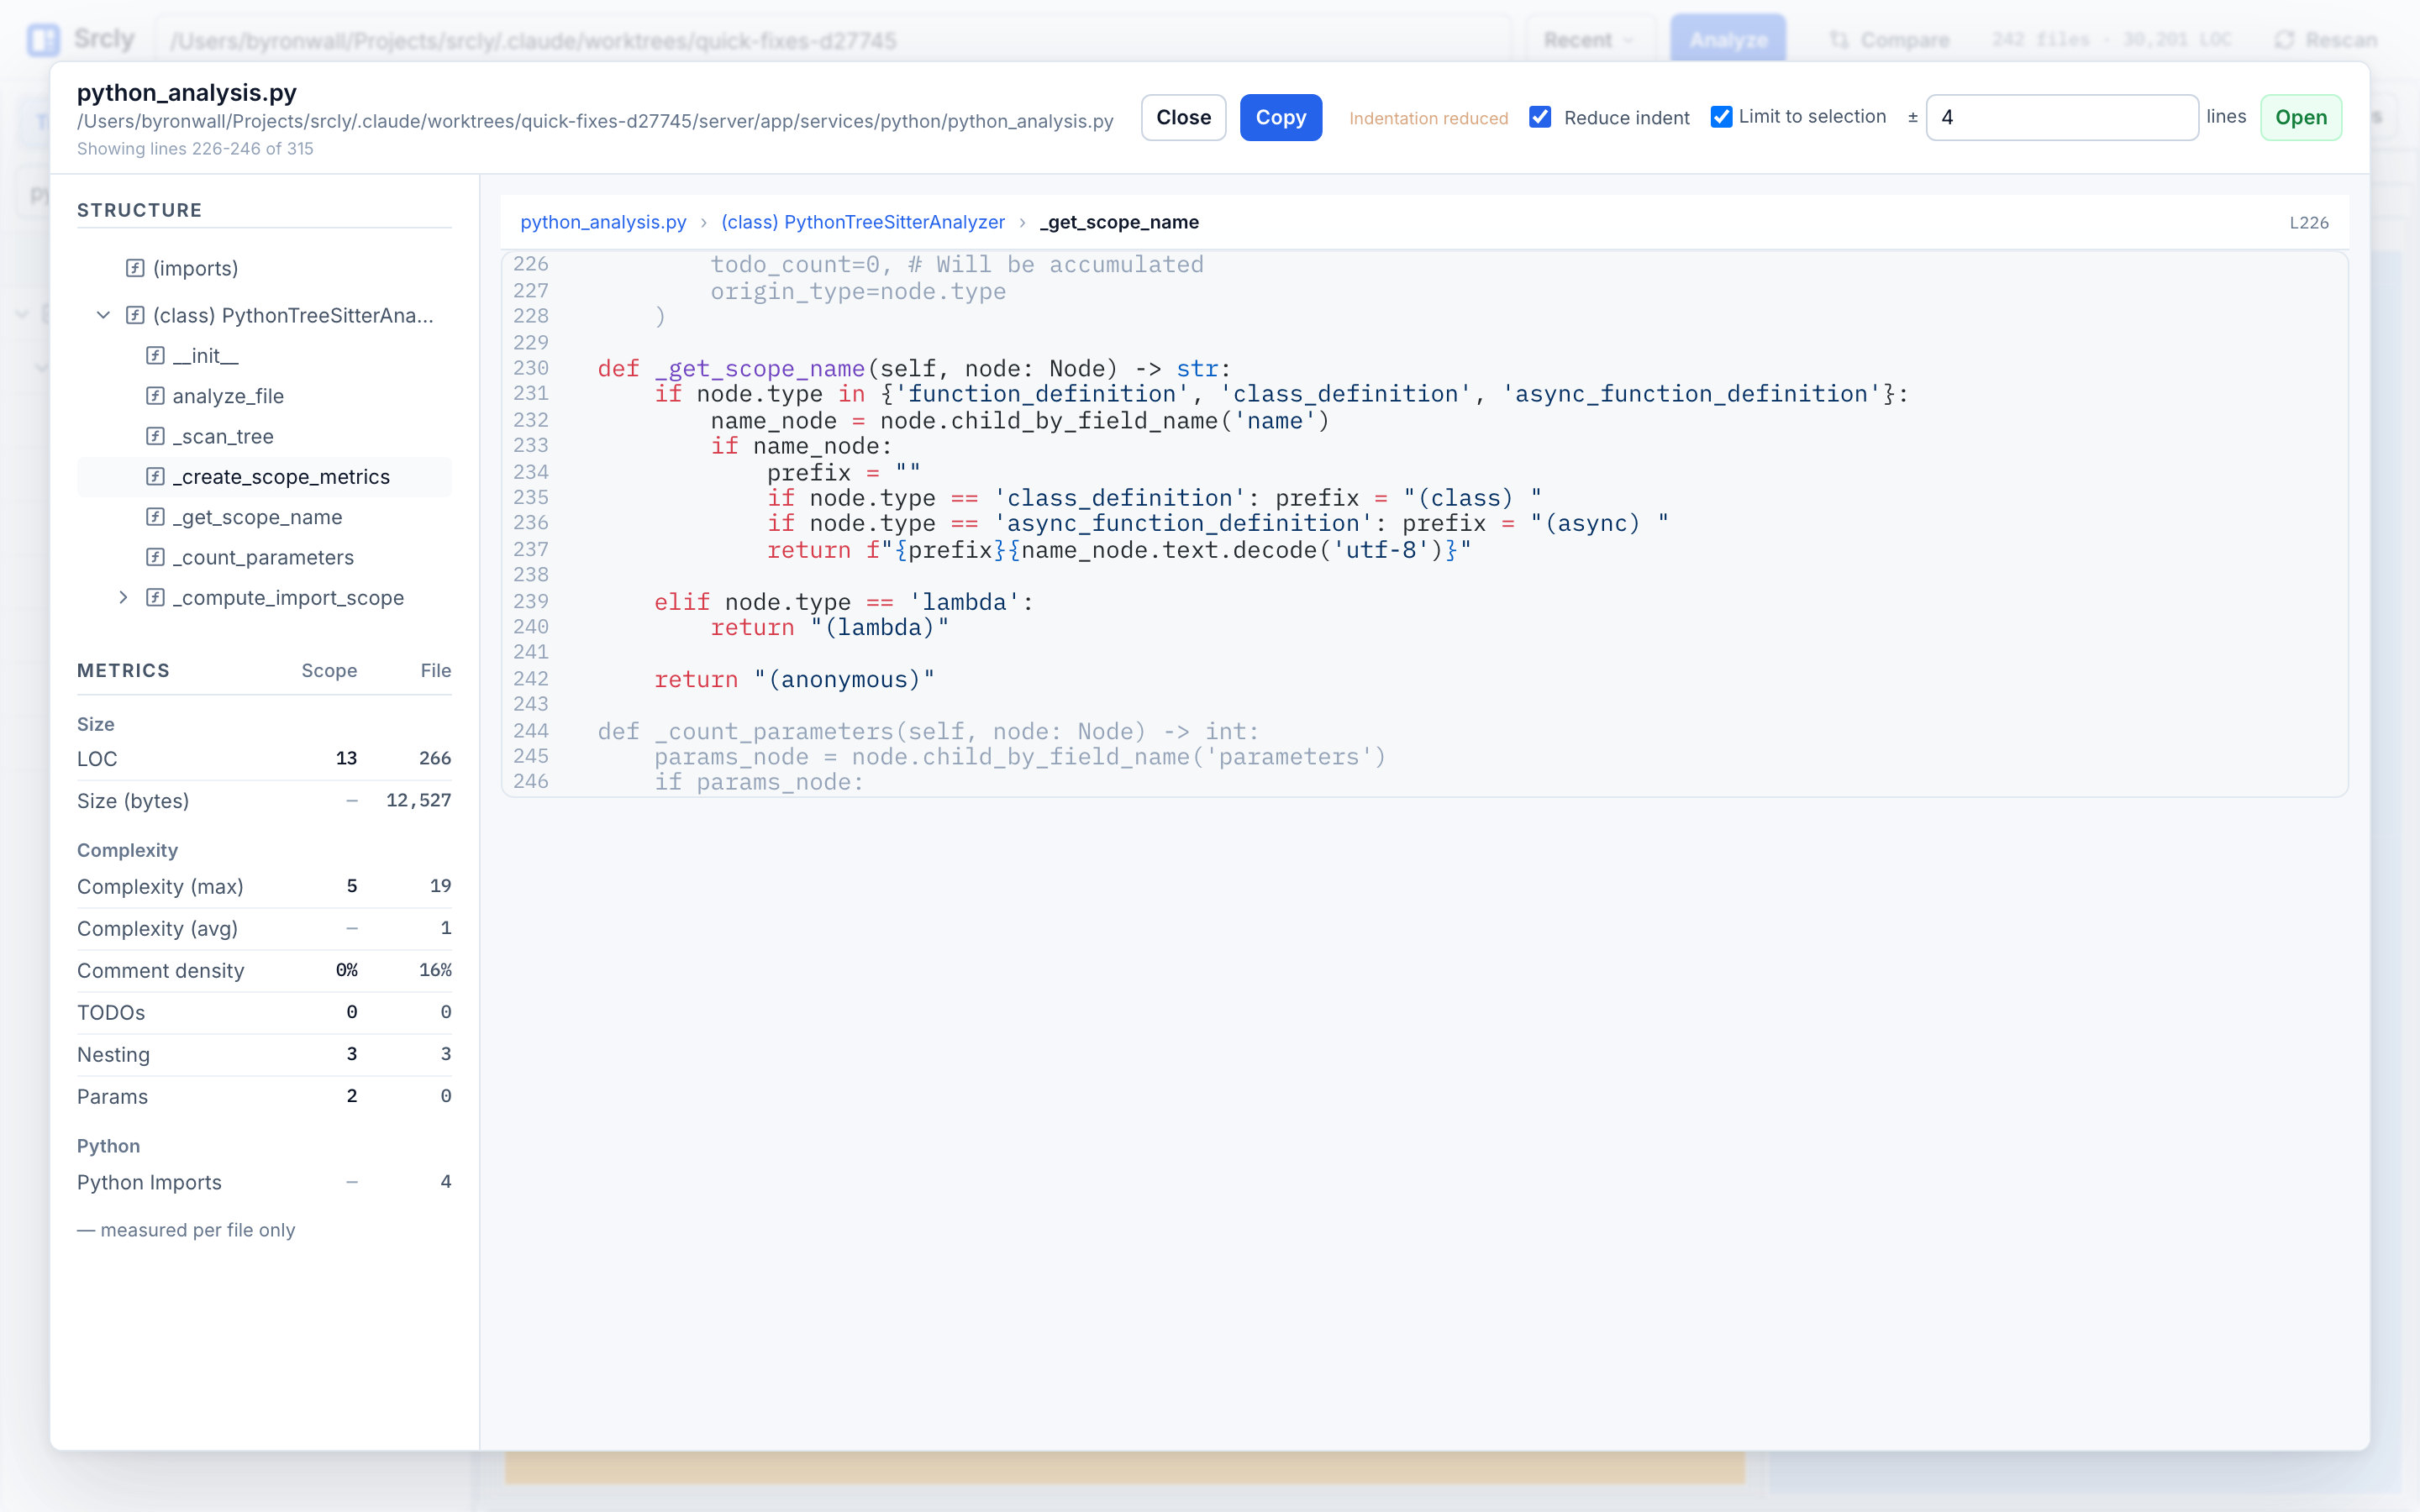
_get_scope_name before and after: 22 rows of mostly irrelevant zeros, then 9 rows that apply, with scope next to file.
A zero for useEffect on a Python function isn't a measurement. It's noise that reads like a measurement. And it turned out to be broader than wrong-language rows. Most TS/TSX metrics are recorded only per file, never per function: all of them were 0 across 3,975 scope nodes on Srcly. So a function showing any Usage 0 was claiming something Srcly never measured.
Each metric now declares its scope and the languages it applies to. The table has one row per metric, with scope and file columns. A file-only metric shows "—" for the scope, with a footnote. A real 0 still shows when the metric applies, because that zero is information.
The viewer around it
The rest of the code viewer got rebuilt to make room for the overlay. The rail holds only metrics now, so the full table fits. The symbol tree moved into an outline popover you open with /, filterable, with each symbol's complexity. The header is one row of controls.
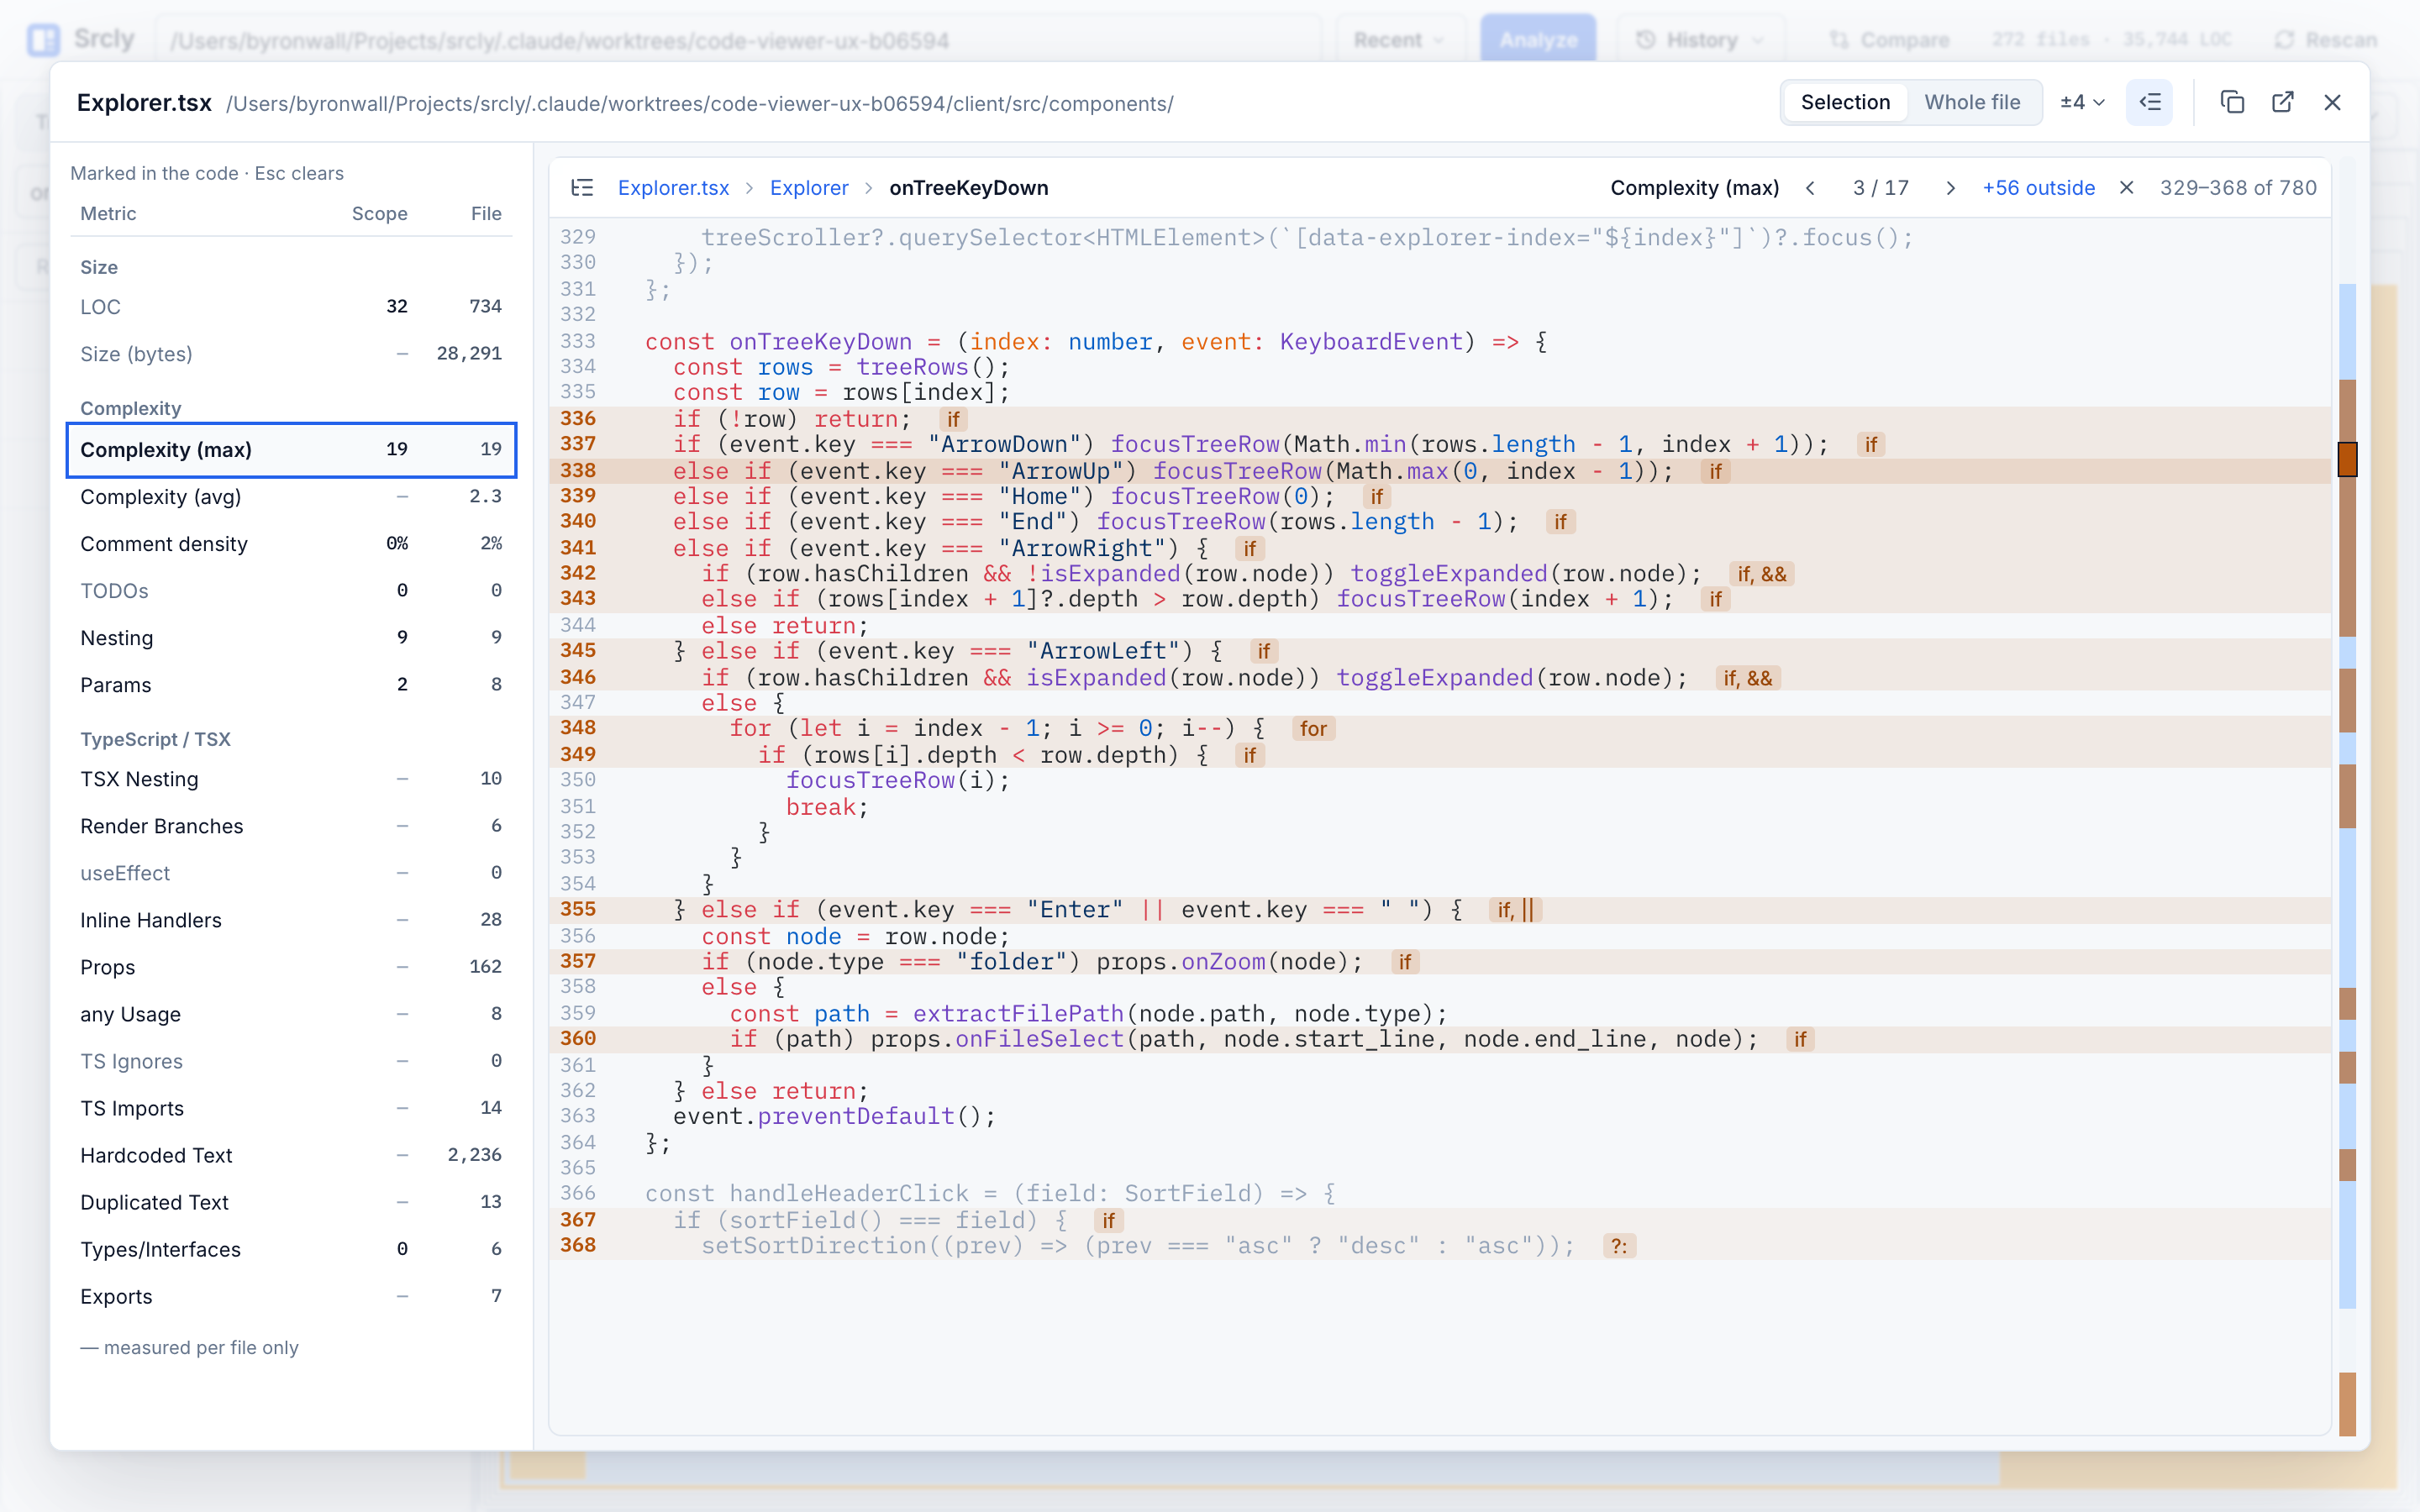
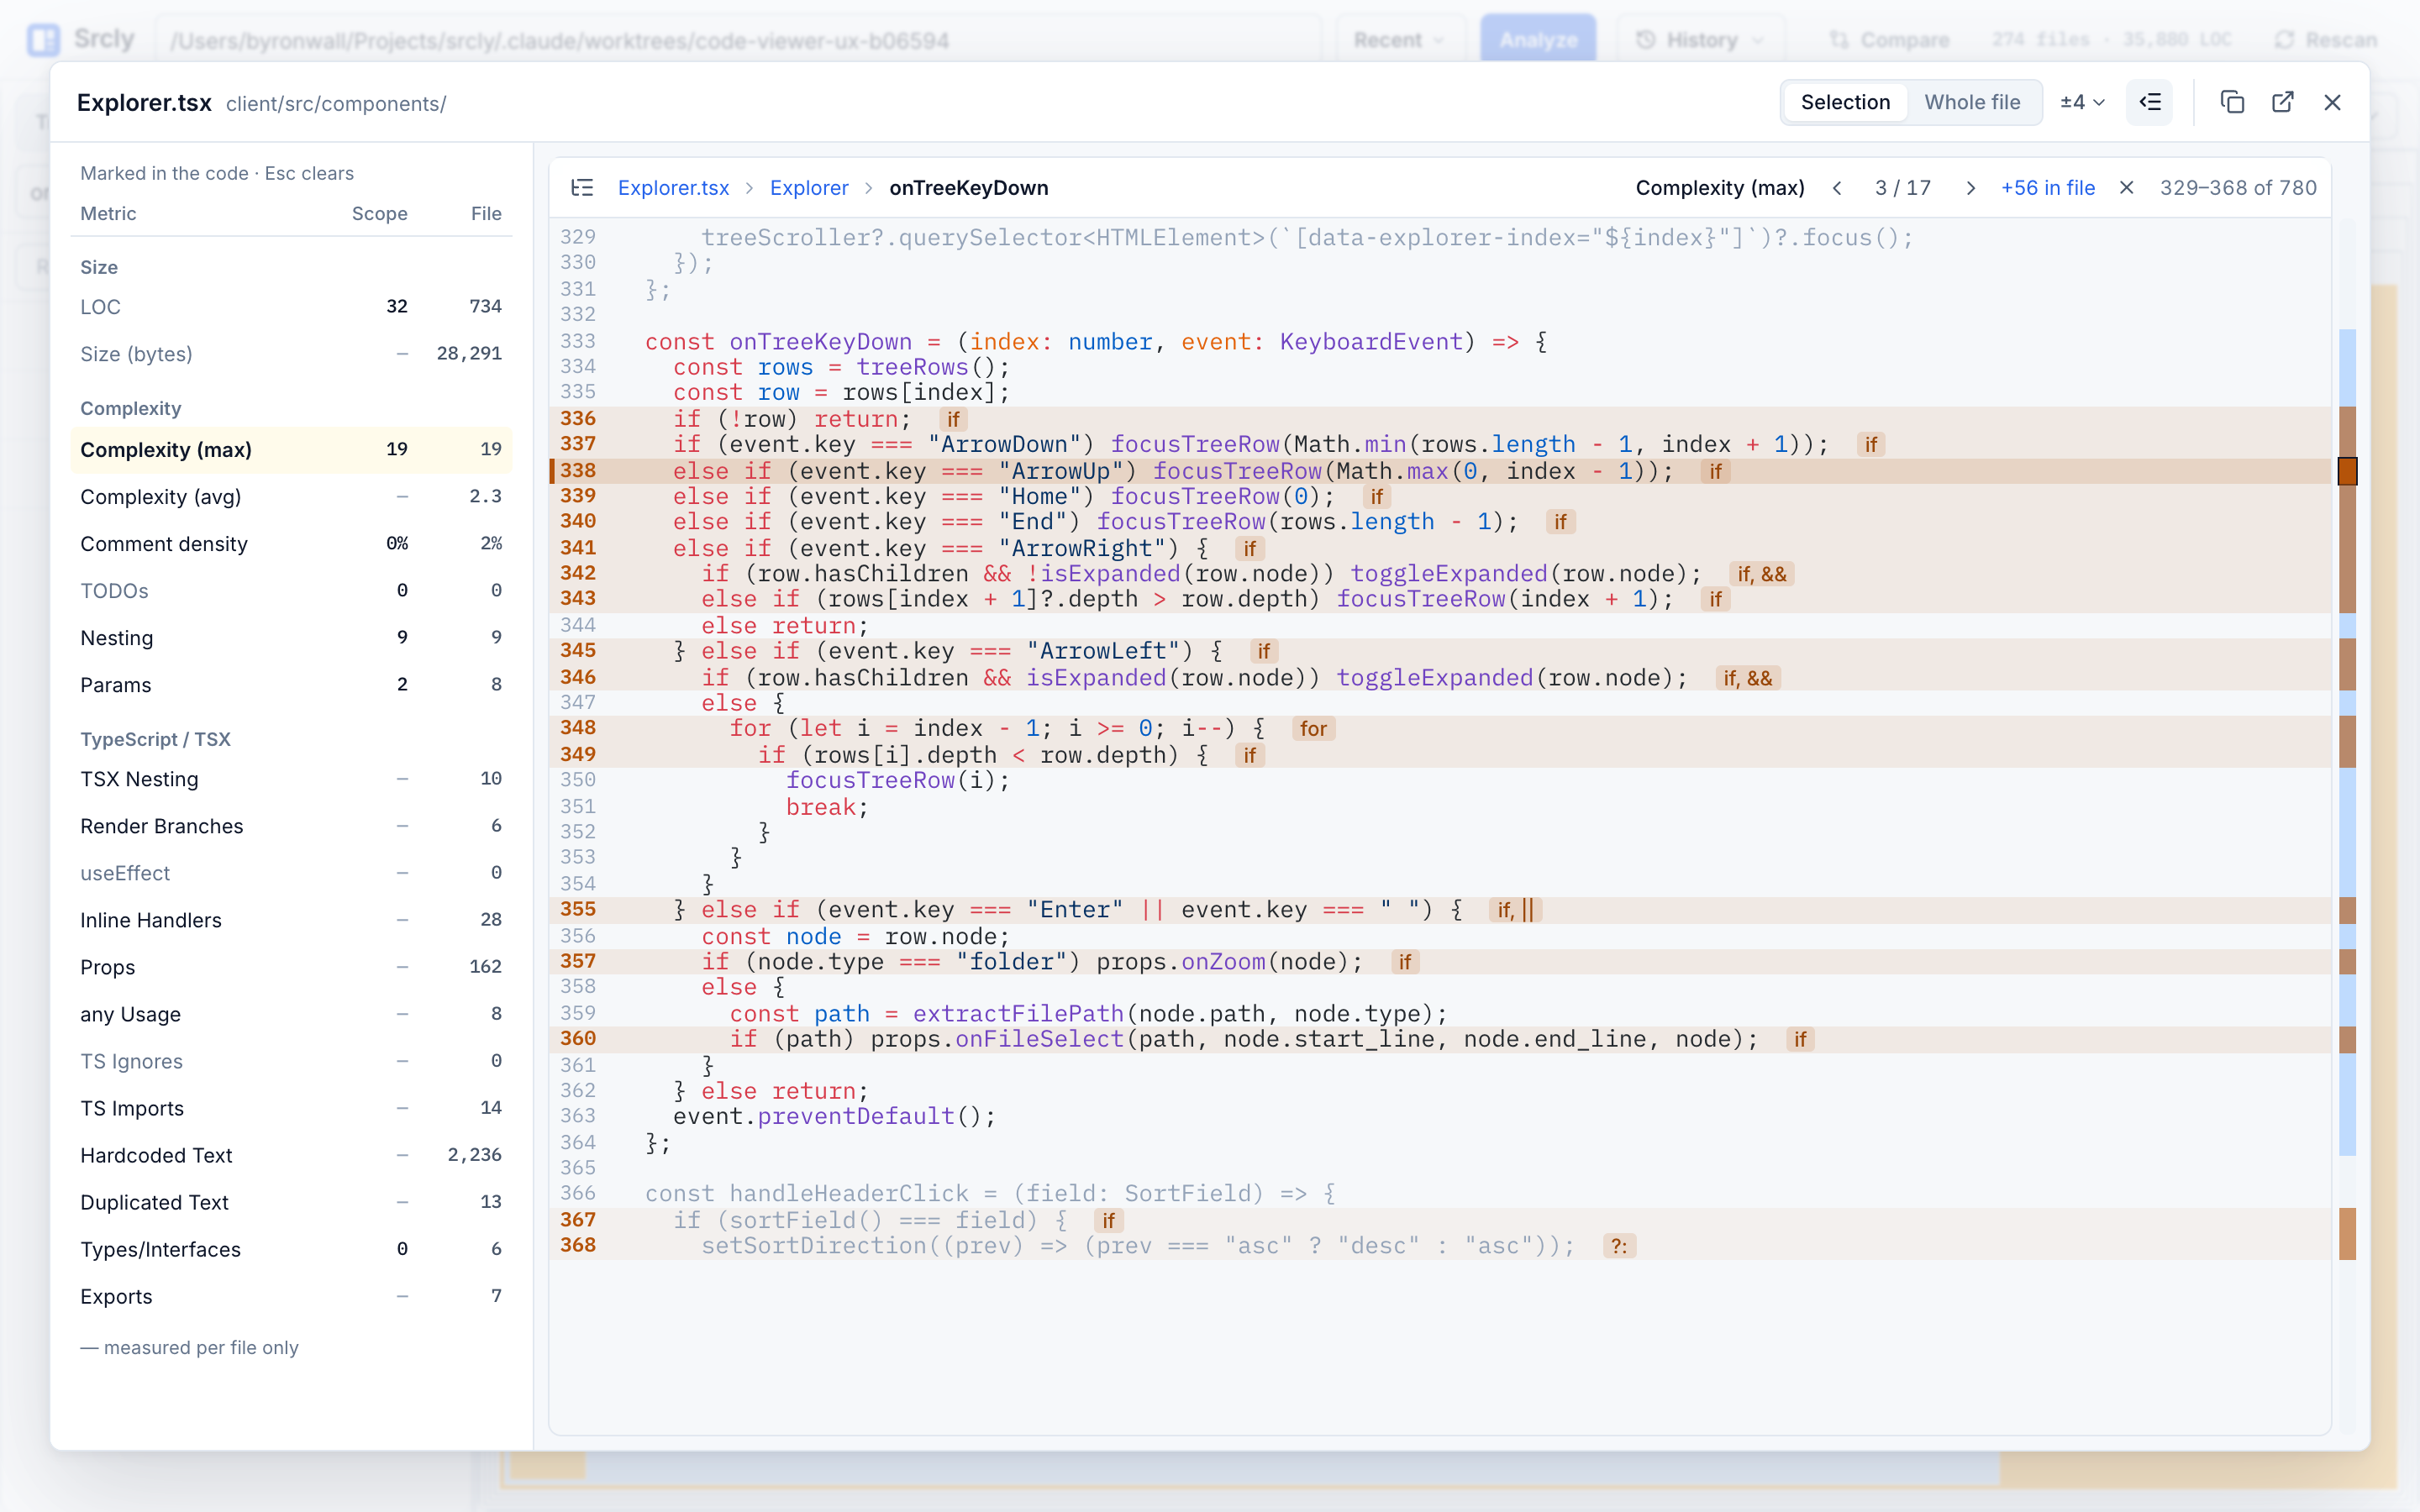
A polish pass worked through a 33-row defect list. Here the ruler had drifted below the lines it marks.
The next step is the same treatment for the metrics themselves. Srcly should separate a real zero from "not measured" everywhere, not just in this table, and show which lines produced a file's number, not just a function's. That work is under way.
Source: byronwall/srcly. Try it with uvx srcly.