Planboard has a session overlay. Click a thread's token count on the Chat Threads page and it reads that Claude Code or Codex session's log in full. You get a chart of every model request, findings for what went wrong or cost the most, a timeline of what the agent said and did, and every tool call with its arguments and result.
The overlay is how llmly ends up inside Planboard. llmly was my separate viewer for where coding sessions spend their tokens. The first version of this overlay ported llmly's session parsing into Planboard and added findings and notes on top, so llmly can retire. One place shows the plans, the PRs and the agent sessions that made them.
That first version had all the data. It was hard to read.
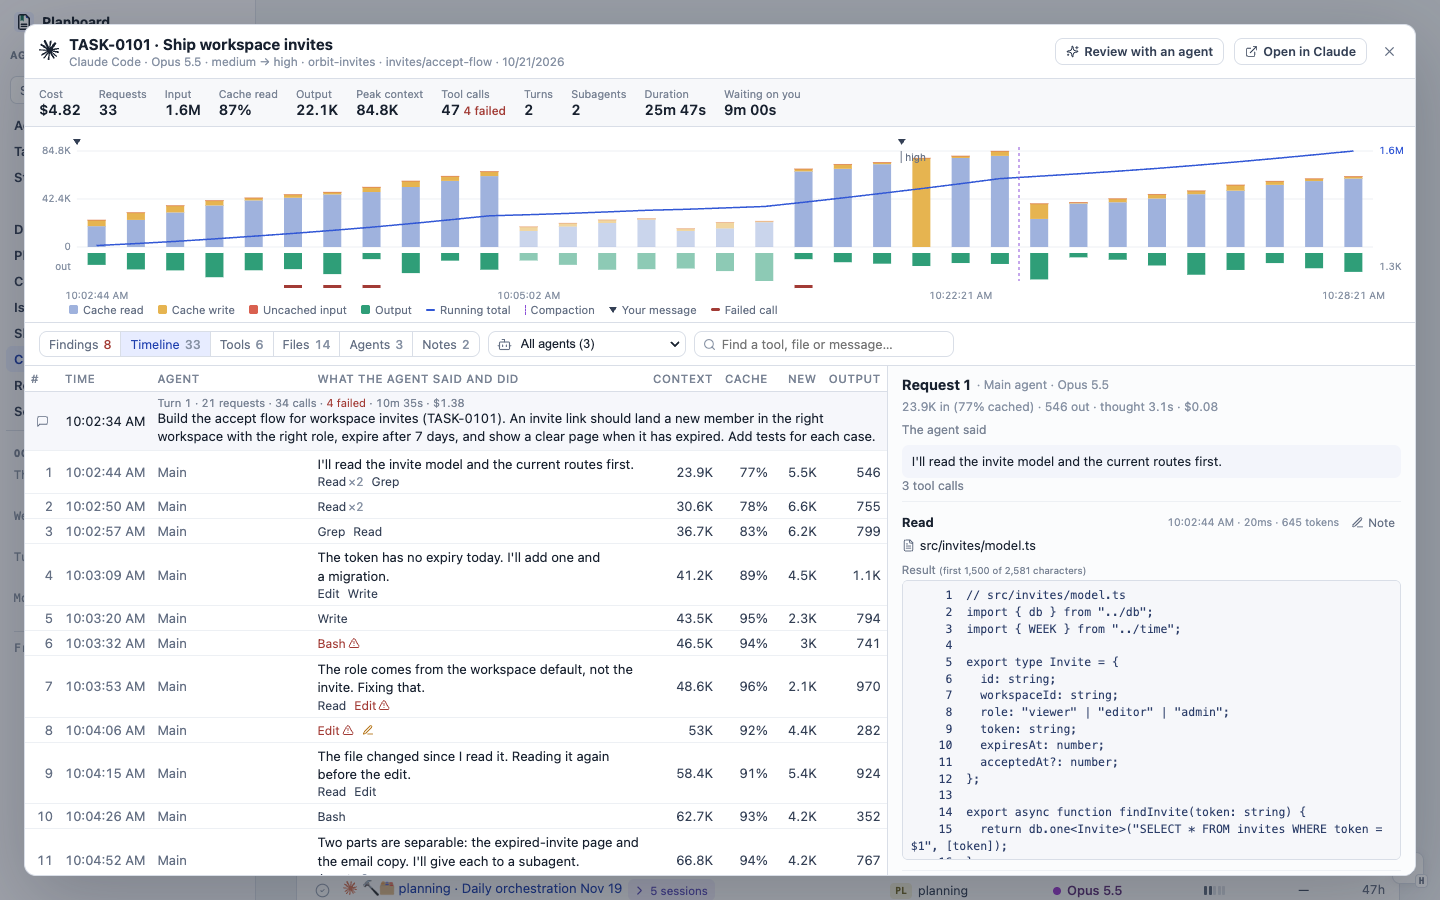
The screenshots in this post use a fictional session from the demo workspace. The UI is the real one.
What I asked for
I gave the agent five notes and ran my 10x skill on them:
- Time is not clear on the x-axis. One session had a cache miss after an idle gap, and nothing on the axis showed the jump.
- The header and chart take too much height. I want the room for the turns and their contents.
- The timeline uses the same font color, weight and type for everything.
- The subagent select menu does not say what each subagent is.
- Bash commands need syntax highlighting or something else to make them readable.
After that pass I kept going in the same thread with five more rounds of notes.
The chart shows time gaps
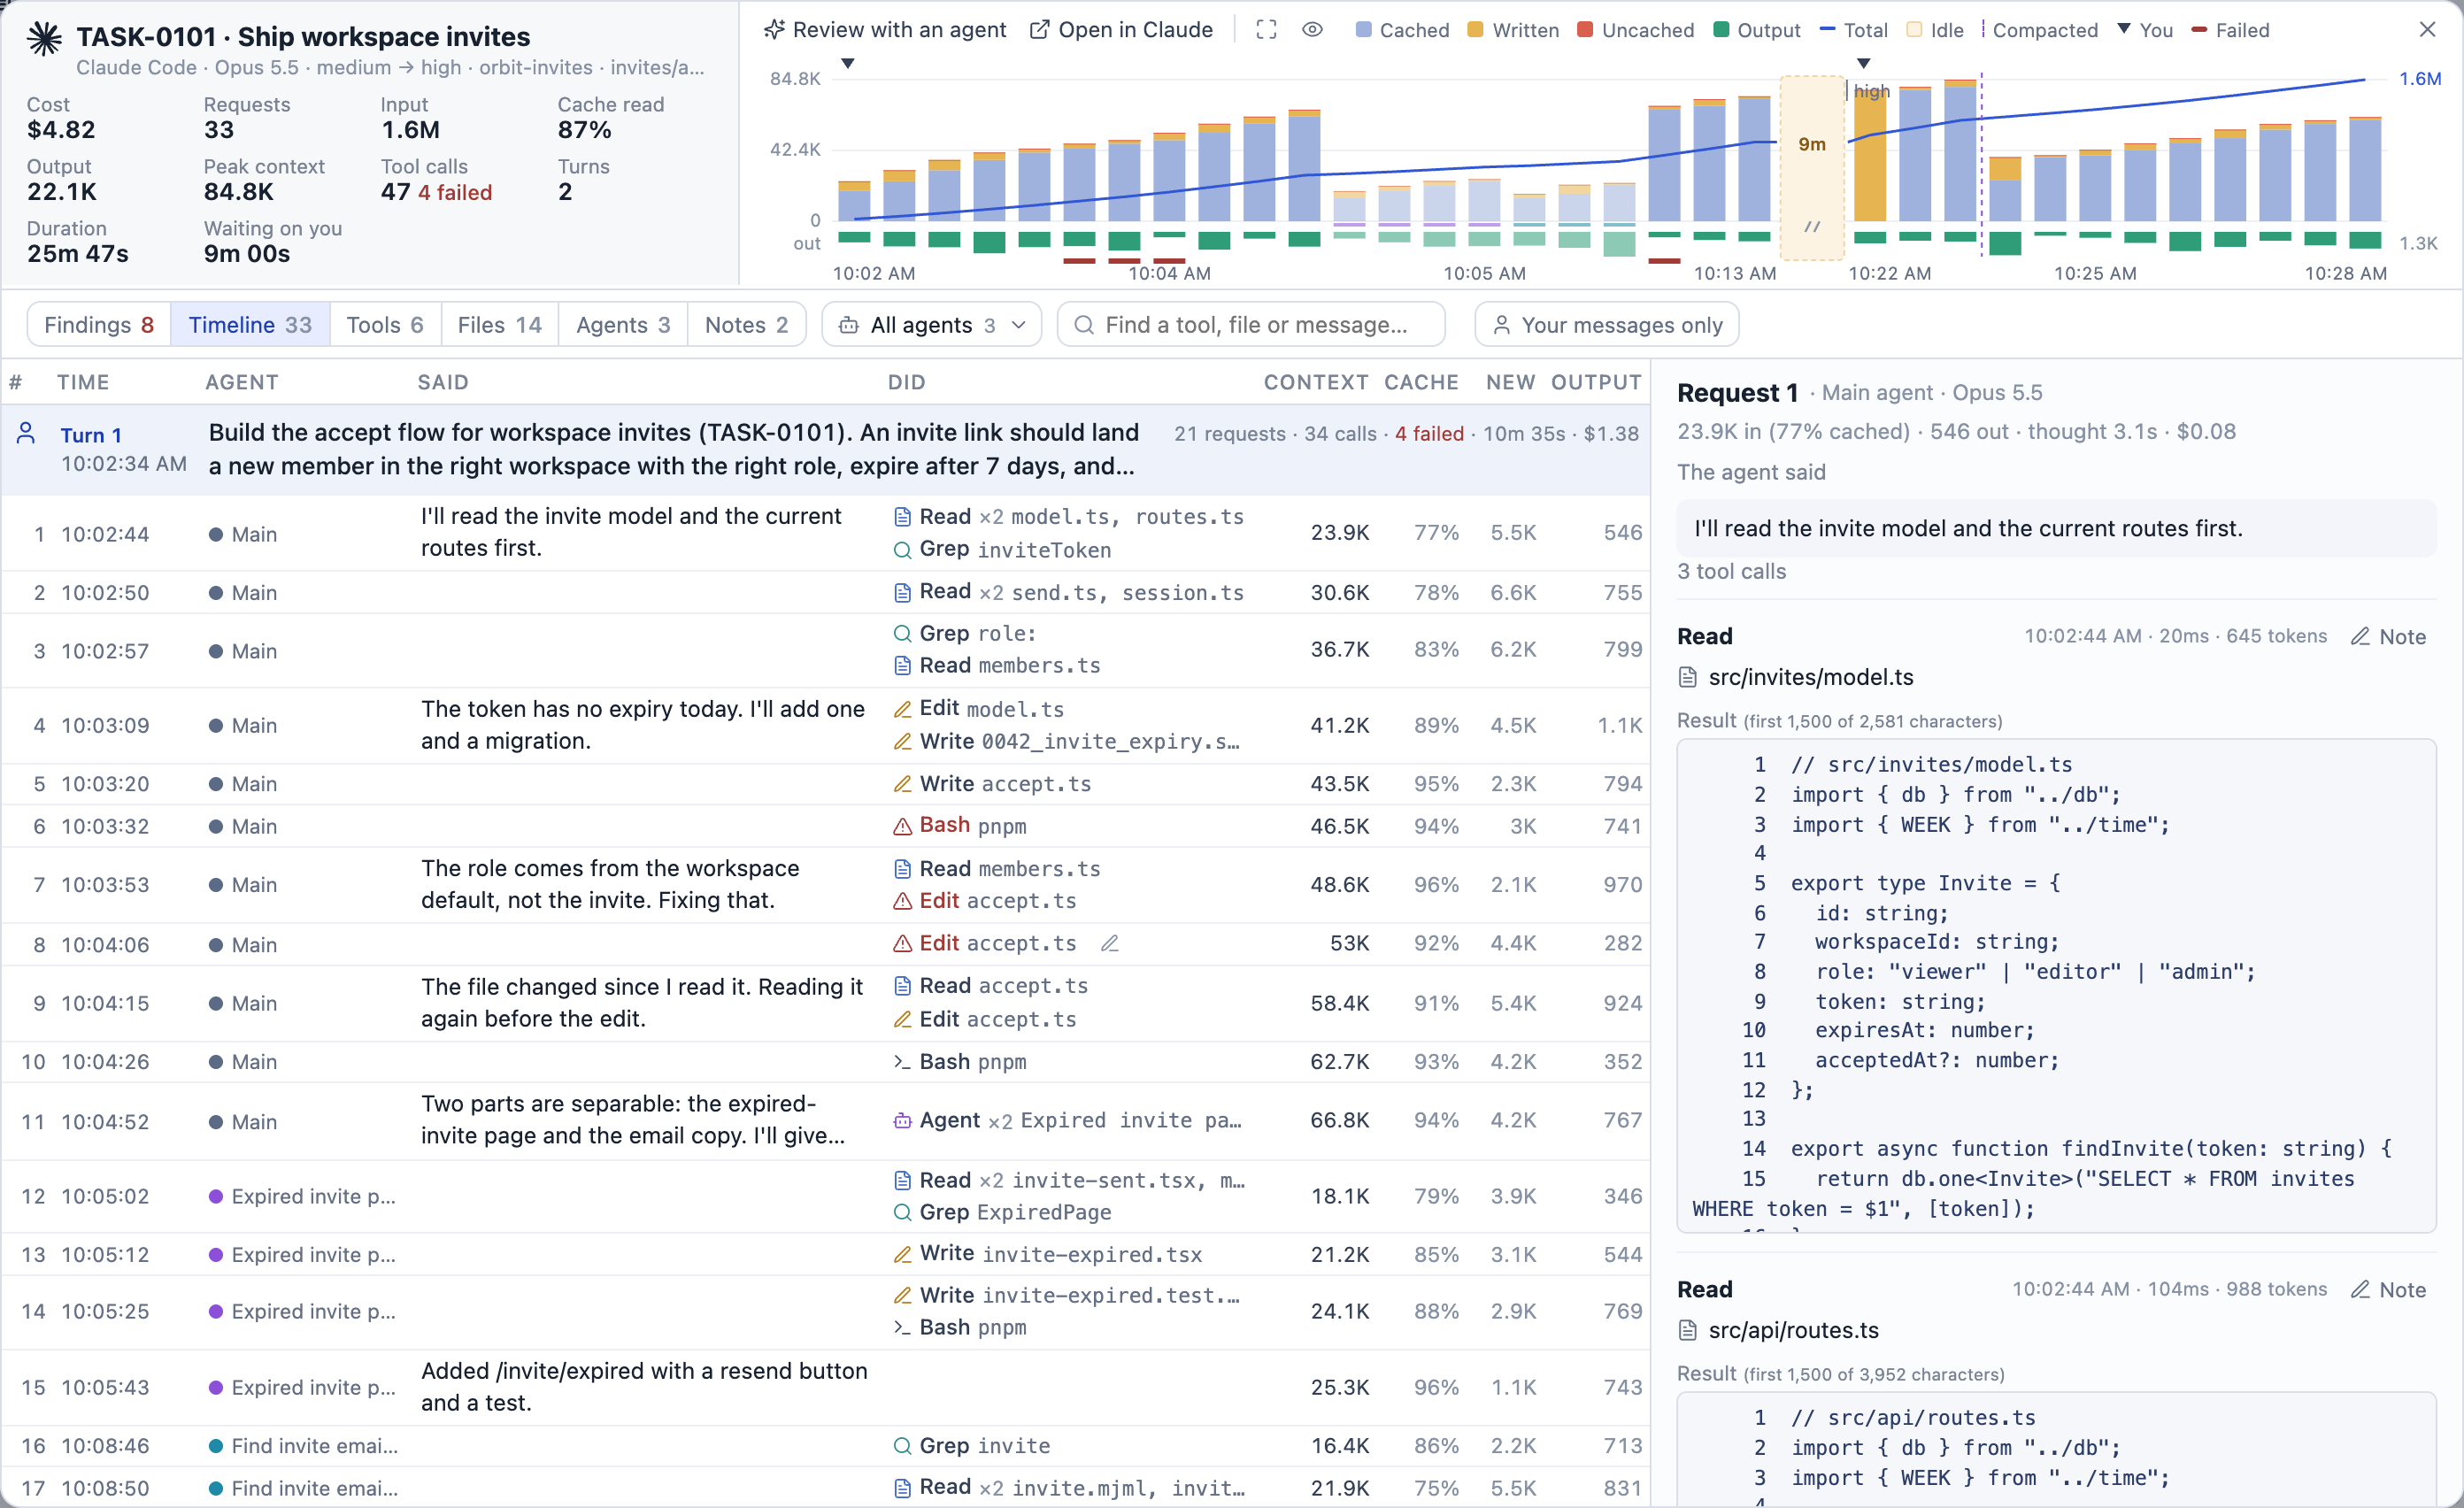
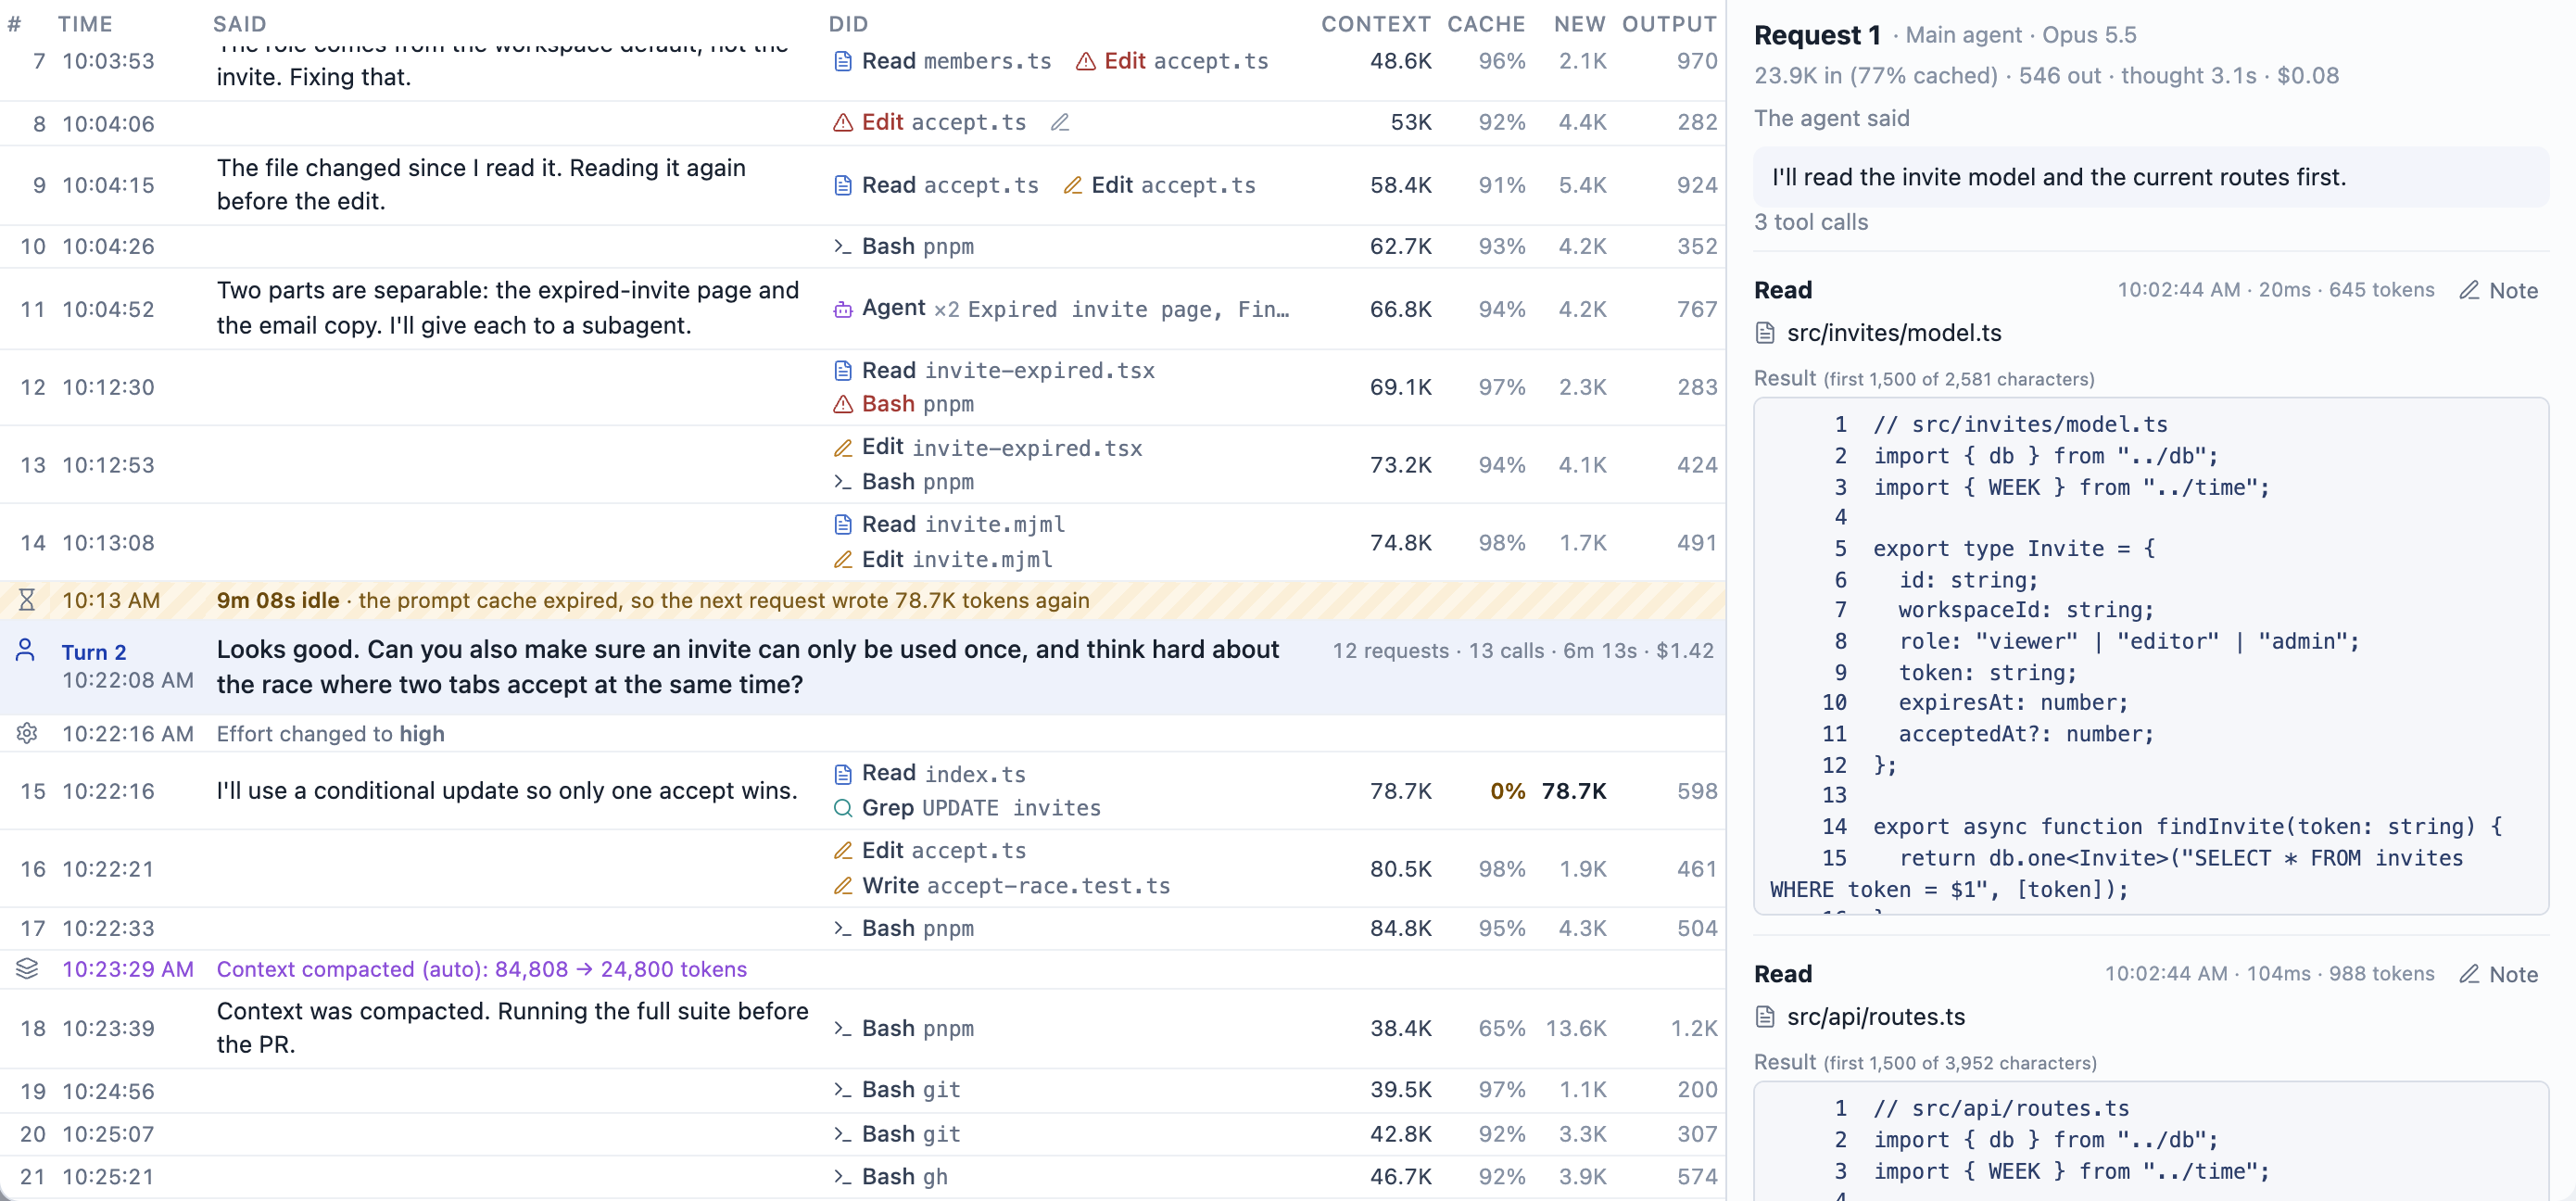
The chart keeps one bar per request, in order, so you can compare requests side by side. When no request ran for longer than the 5-minute prompt cache, the bars now break with a hatched gap that names its length. The break is amber when the next request had to send the whole context again, and gray when the cache held. Clock labels sit on both sides of every break, so 10:13 AM | 9m | 10:22 AM reads as a jump in time.

The running total steps flat across a break, so the jump in time does not look like a jump in tokens.
More room for the timeline
This took three rounds. First the totals went onto one line. Then I asked for the chart beside the header data and an expand button. Then I asked for the chart at the very top of the overlay, with the buttons moved to the left.
The separate header row is gone now. The title, models, folder and totals sit on the left, and the chart runs to the top on the right. The bar above the chart holds Review with an agent and Open in Claude, the chart buttons, the color key and close.

The chart has three sizes, and the browser remembers the choice. Beside the totals is the default. Widen gives it the full width and a taller plot. Hide removes it, which puts the timeline right under the toolbar.
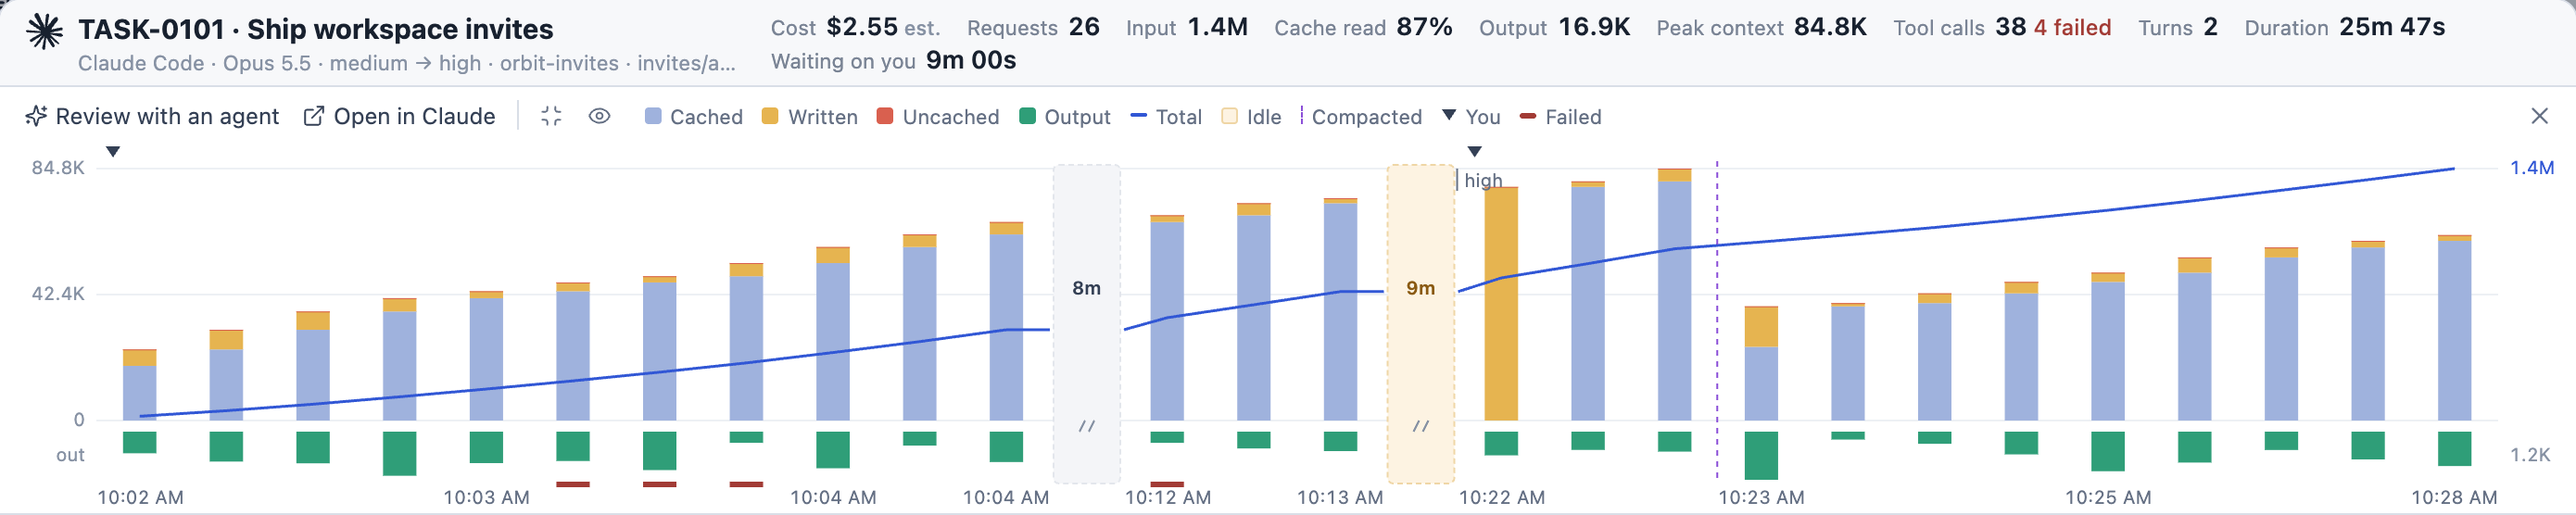
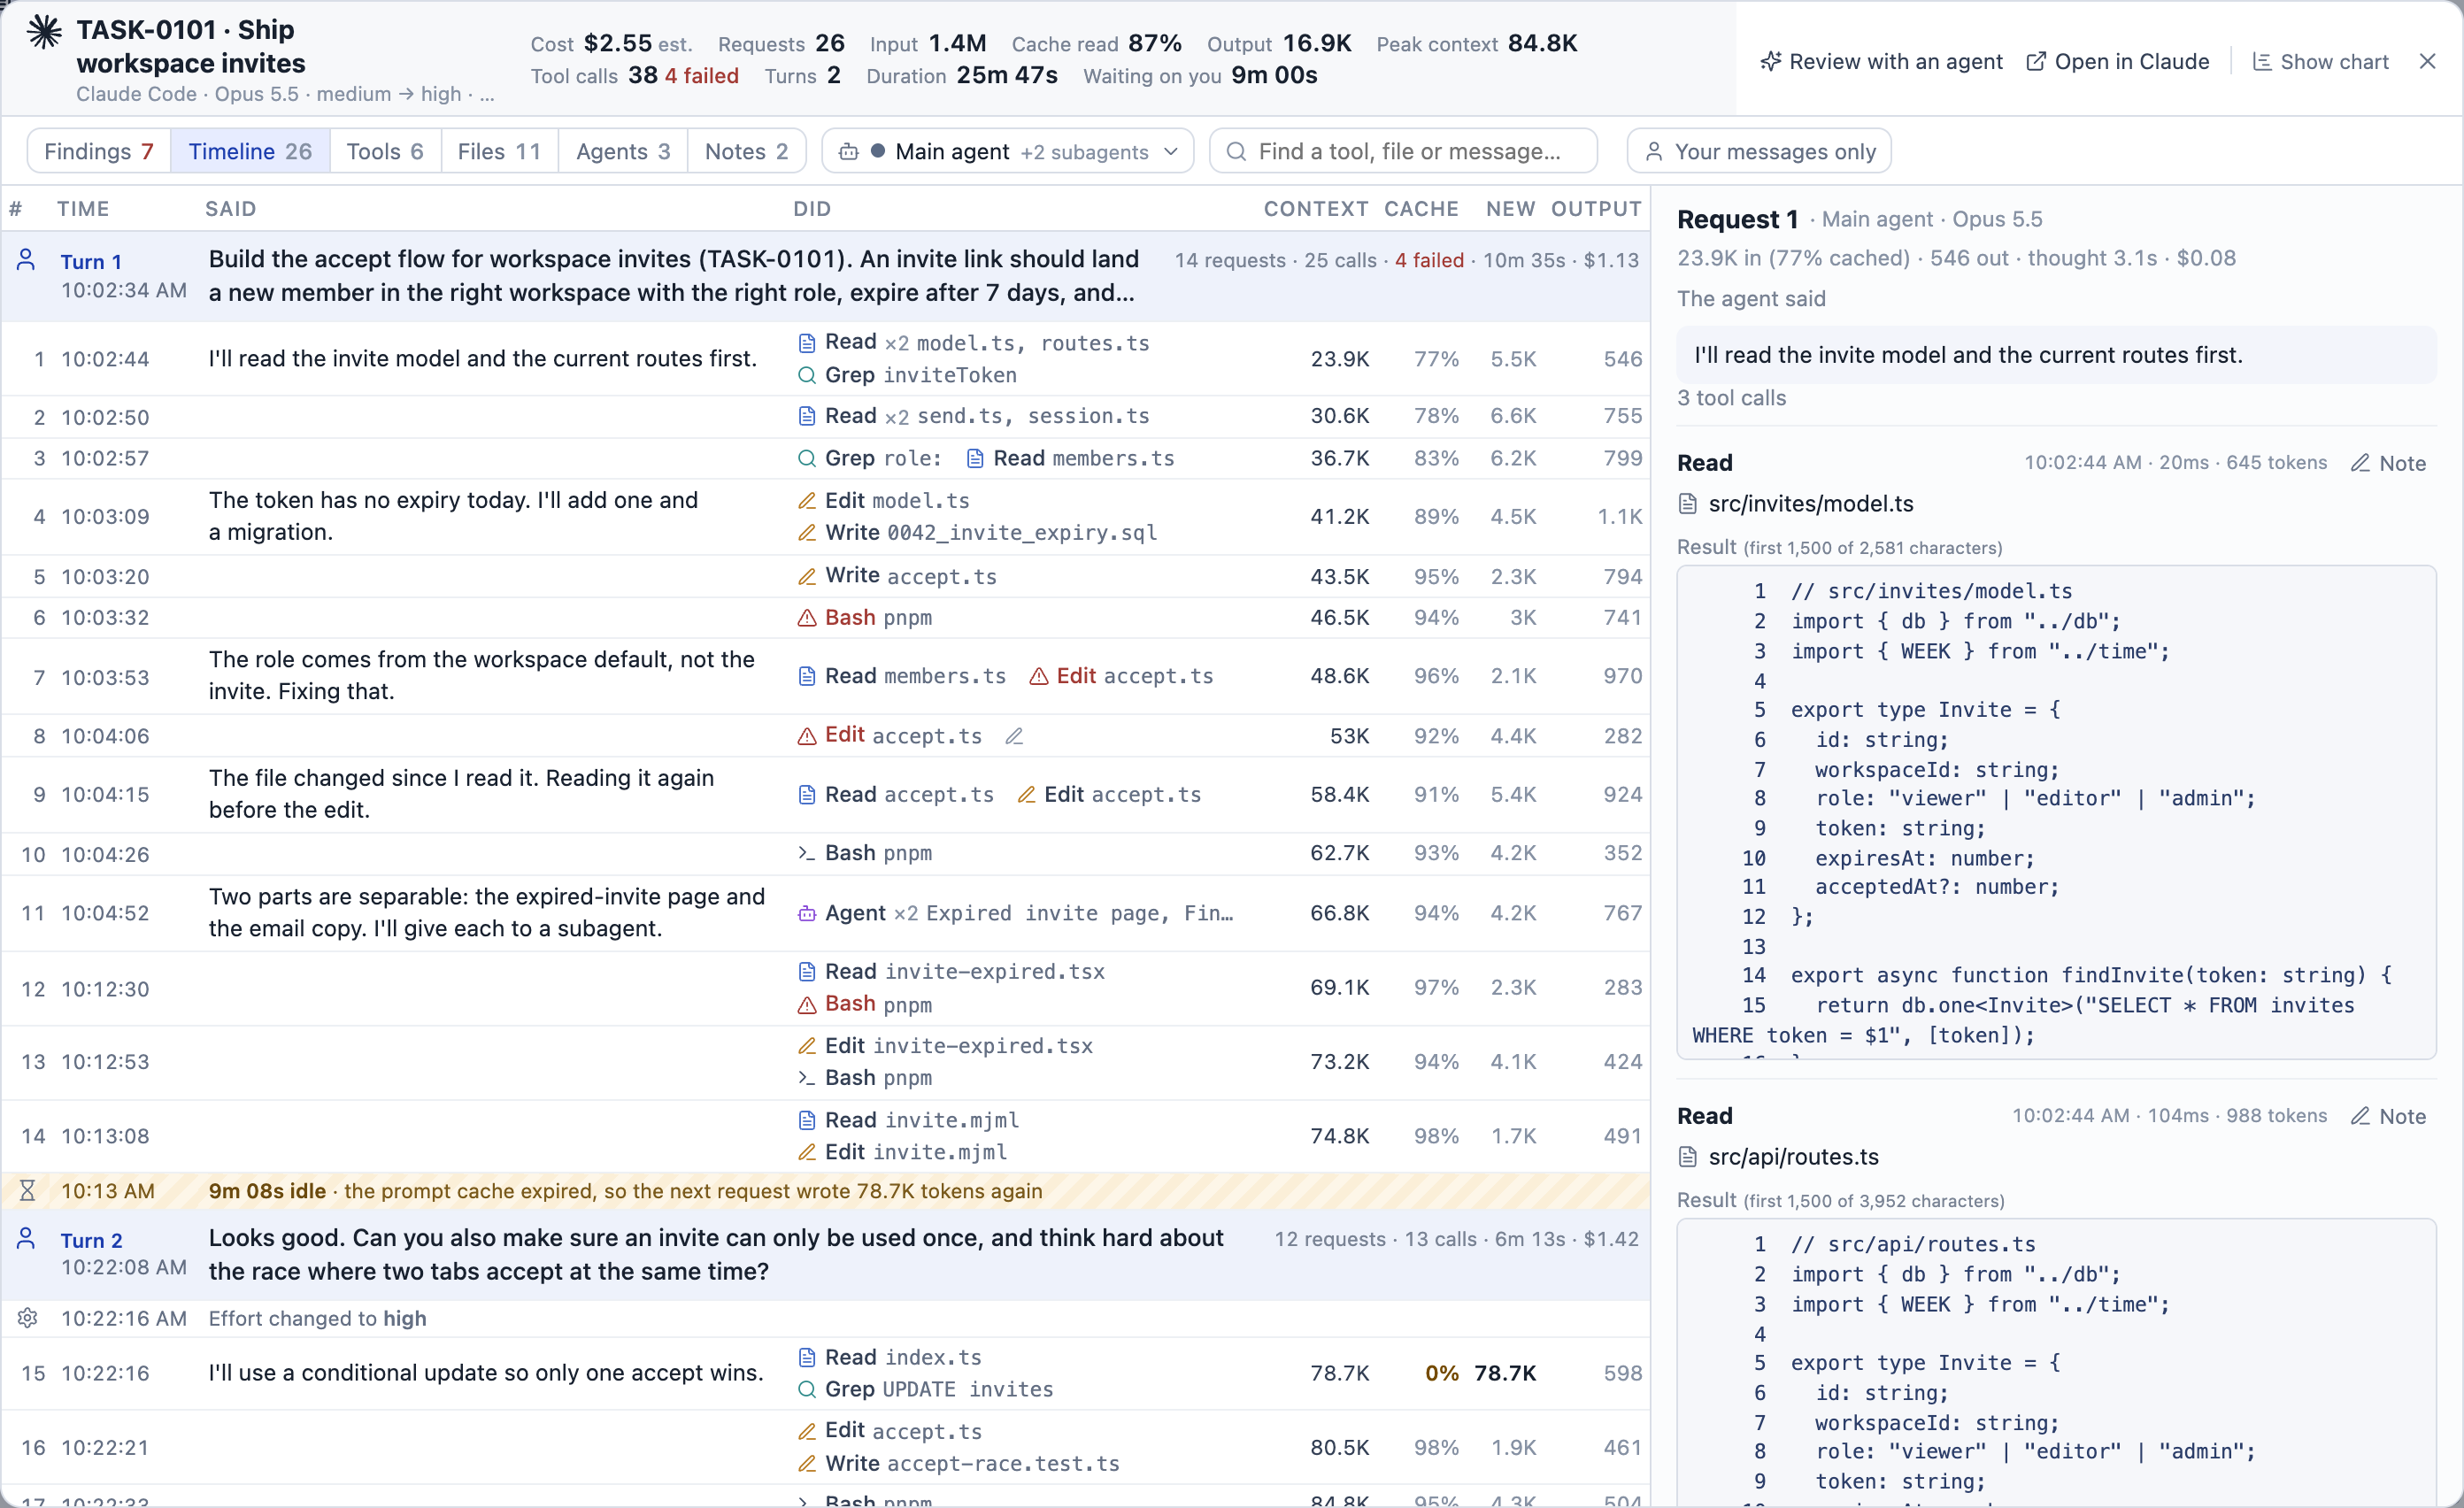
The timeline used to start about 365px down the screen. It starts around 230px now, or about 150px with the chart hidden.
A timeline with structure
The timeline went through the most rounds. Each one came from a screenshot where something still looked off.
Each request is now one line where it fits. Said holds what the agent wrote before acting, with the Markdown marks stripped. Did lists the tools, each with an icon for its kind and a short monospace note on what it touched: the programs a shell call ran, a file's name, a search pattern. Numbers stay dim unless they matter. A cache share under 50% turns amber, and a big chunk of new input turns bold.
Your messages head each turn on a blue tint, with the turn's requests, calls, time and cost on the right. "Turn 2" sits above the time in the left column. When it sat in front of the message, it pushed the text over and the agent's reply below it no longer lined up. Idle gaps, compactions and effort changes get their own thin rows between the requests.
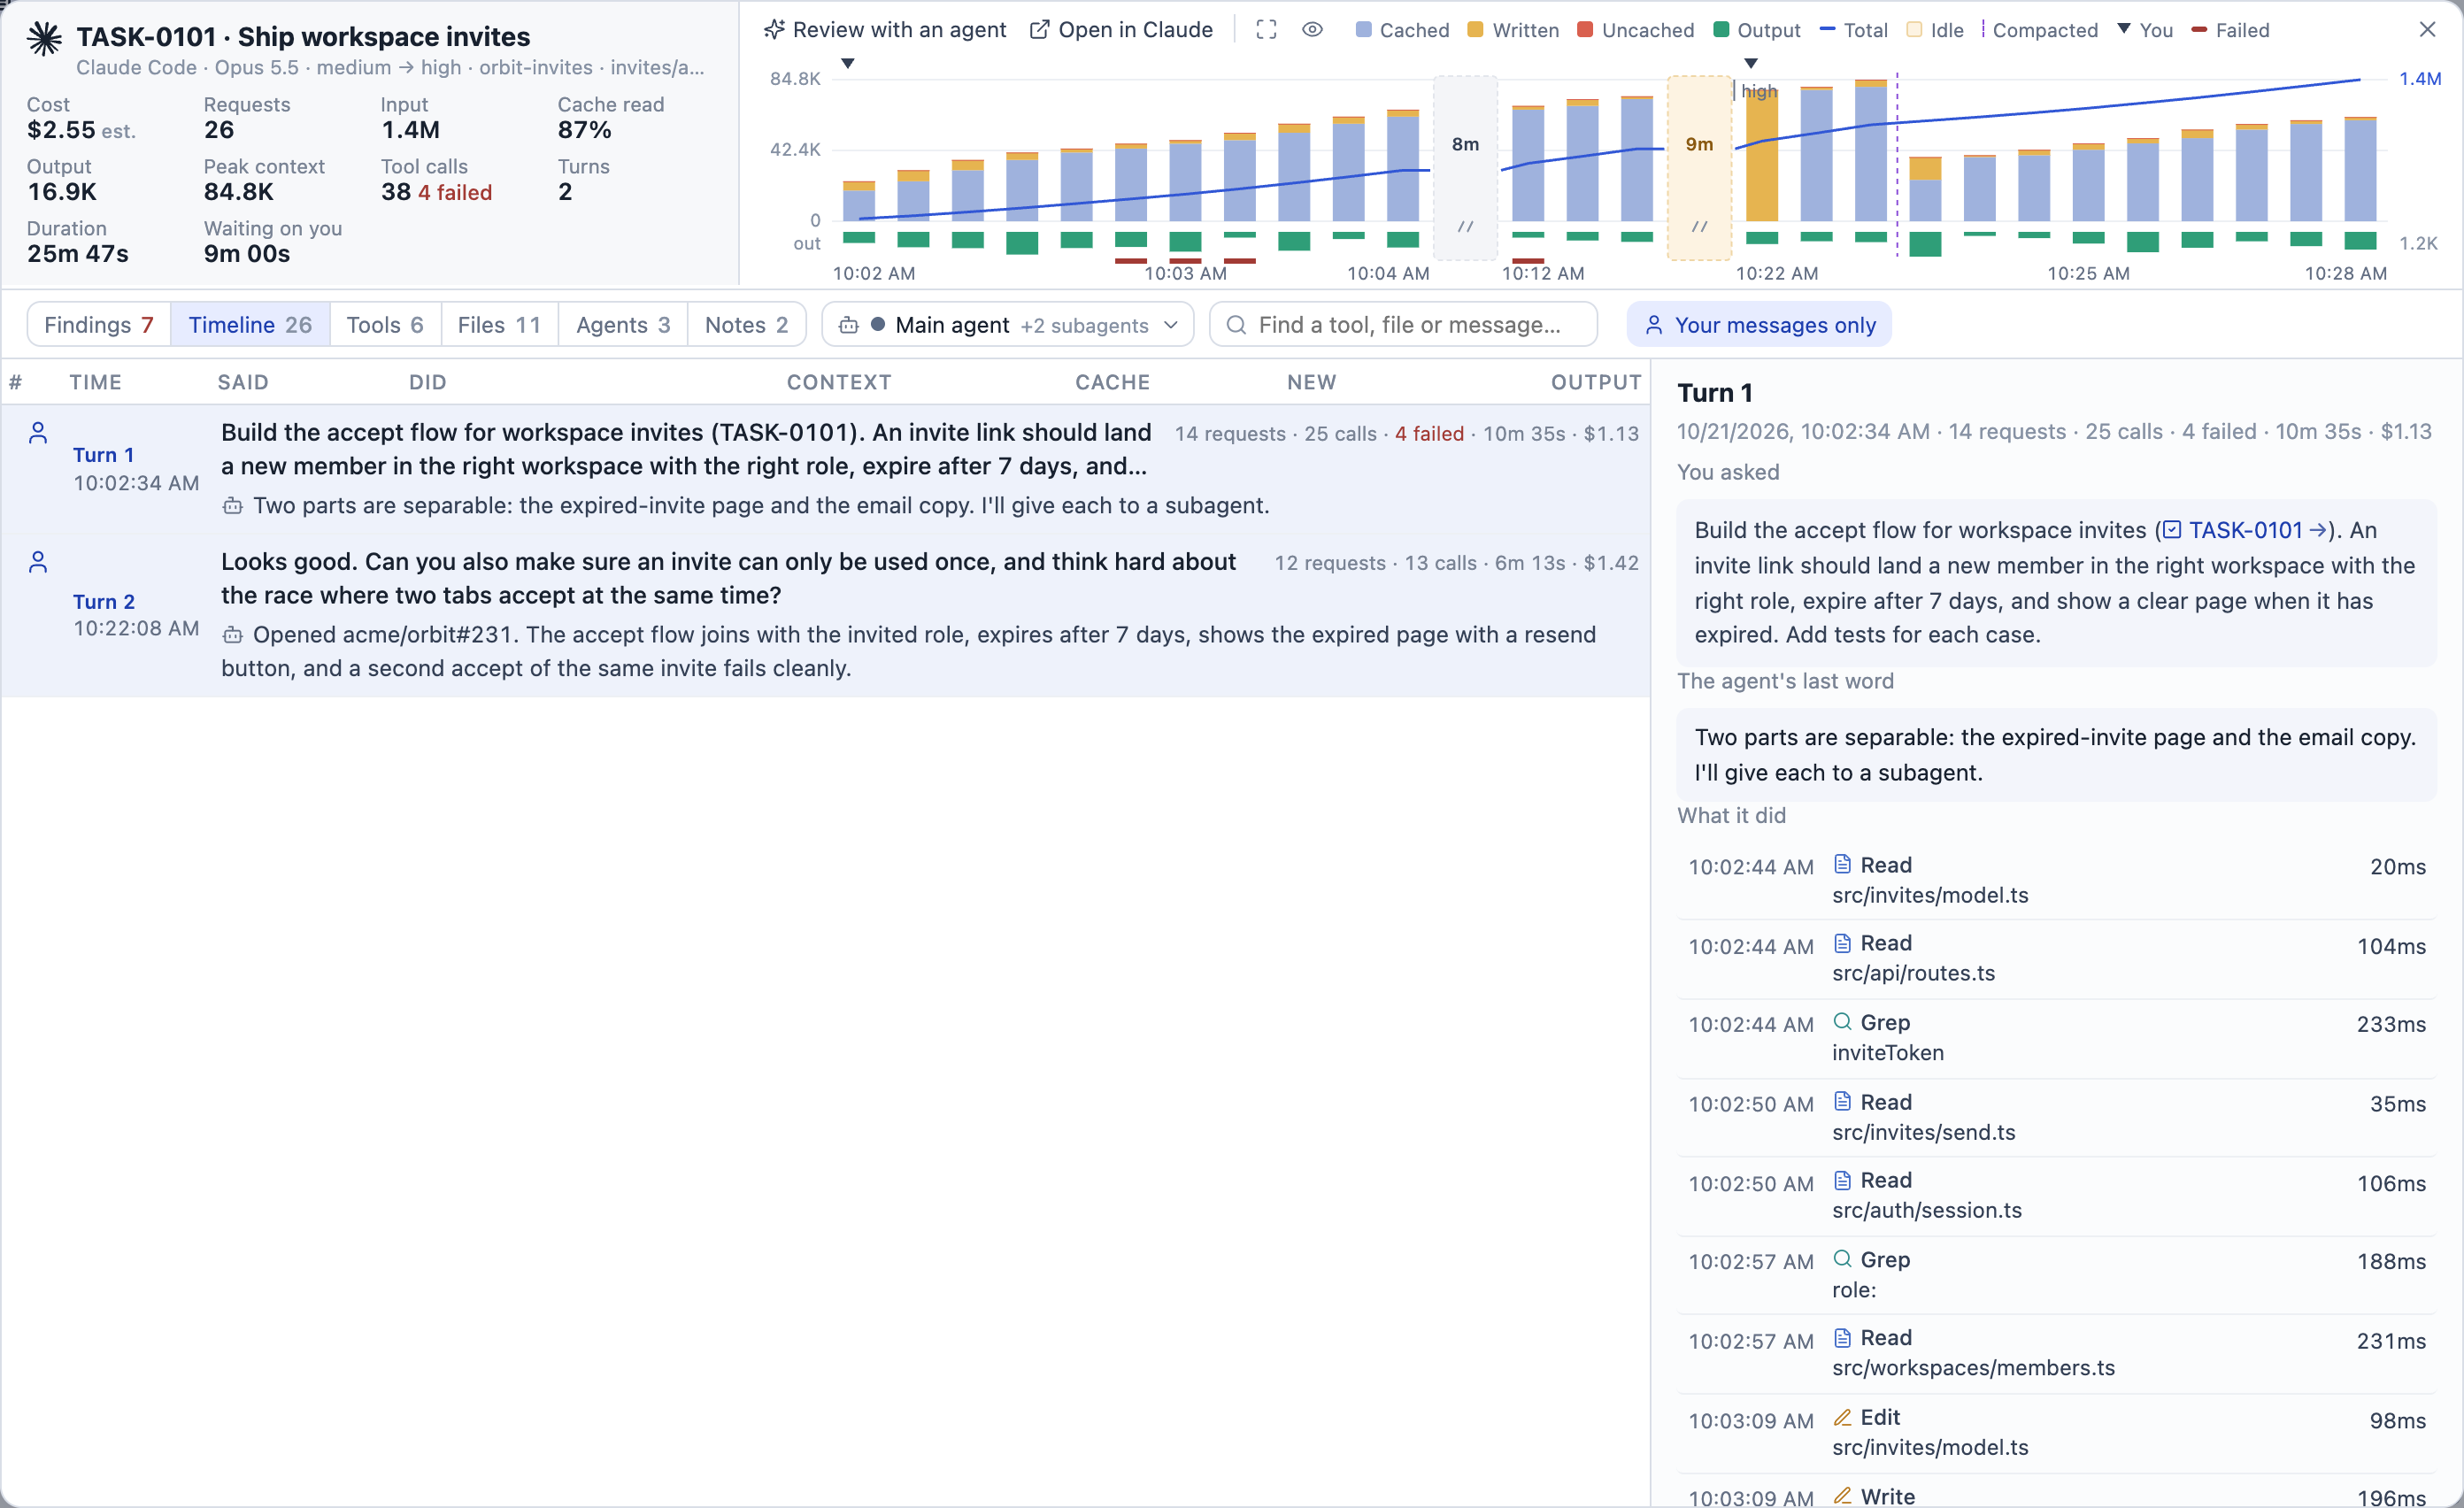
I also wanted to filter to just my messages. Your messages only keeps one row per turn, each with the agent's last reply, so the list reads as the conversation.
Subagents in the agent menu
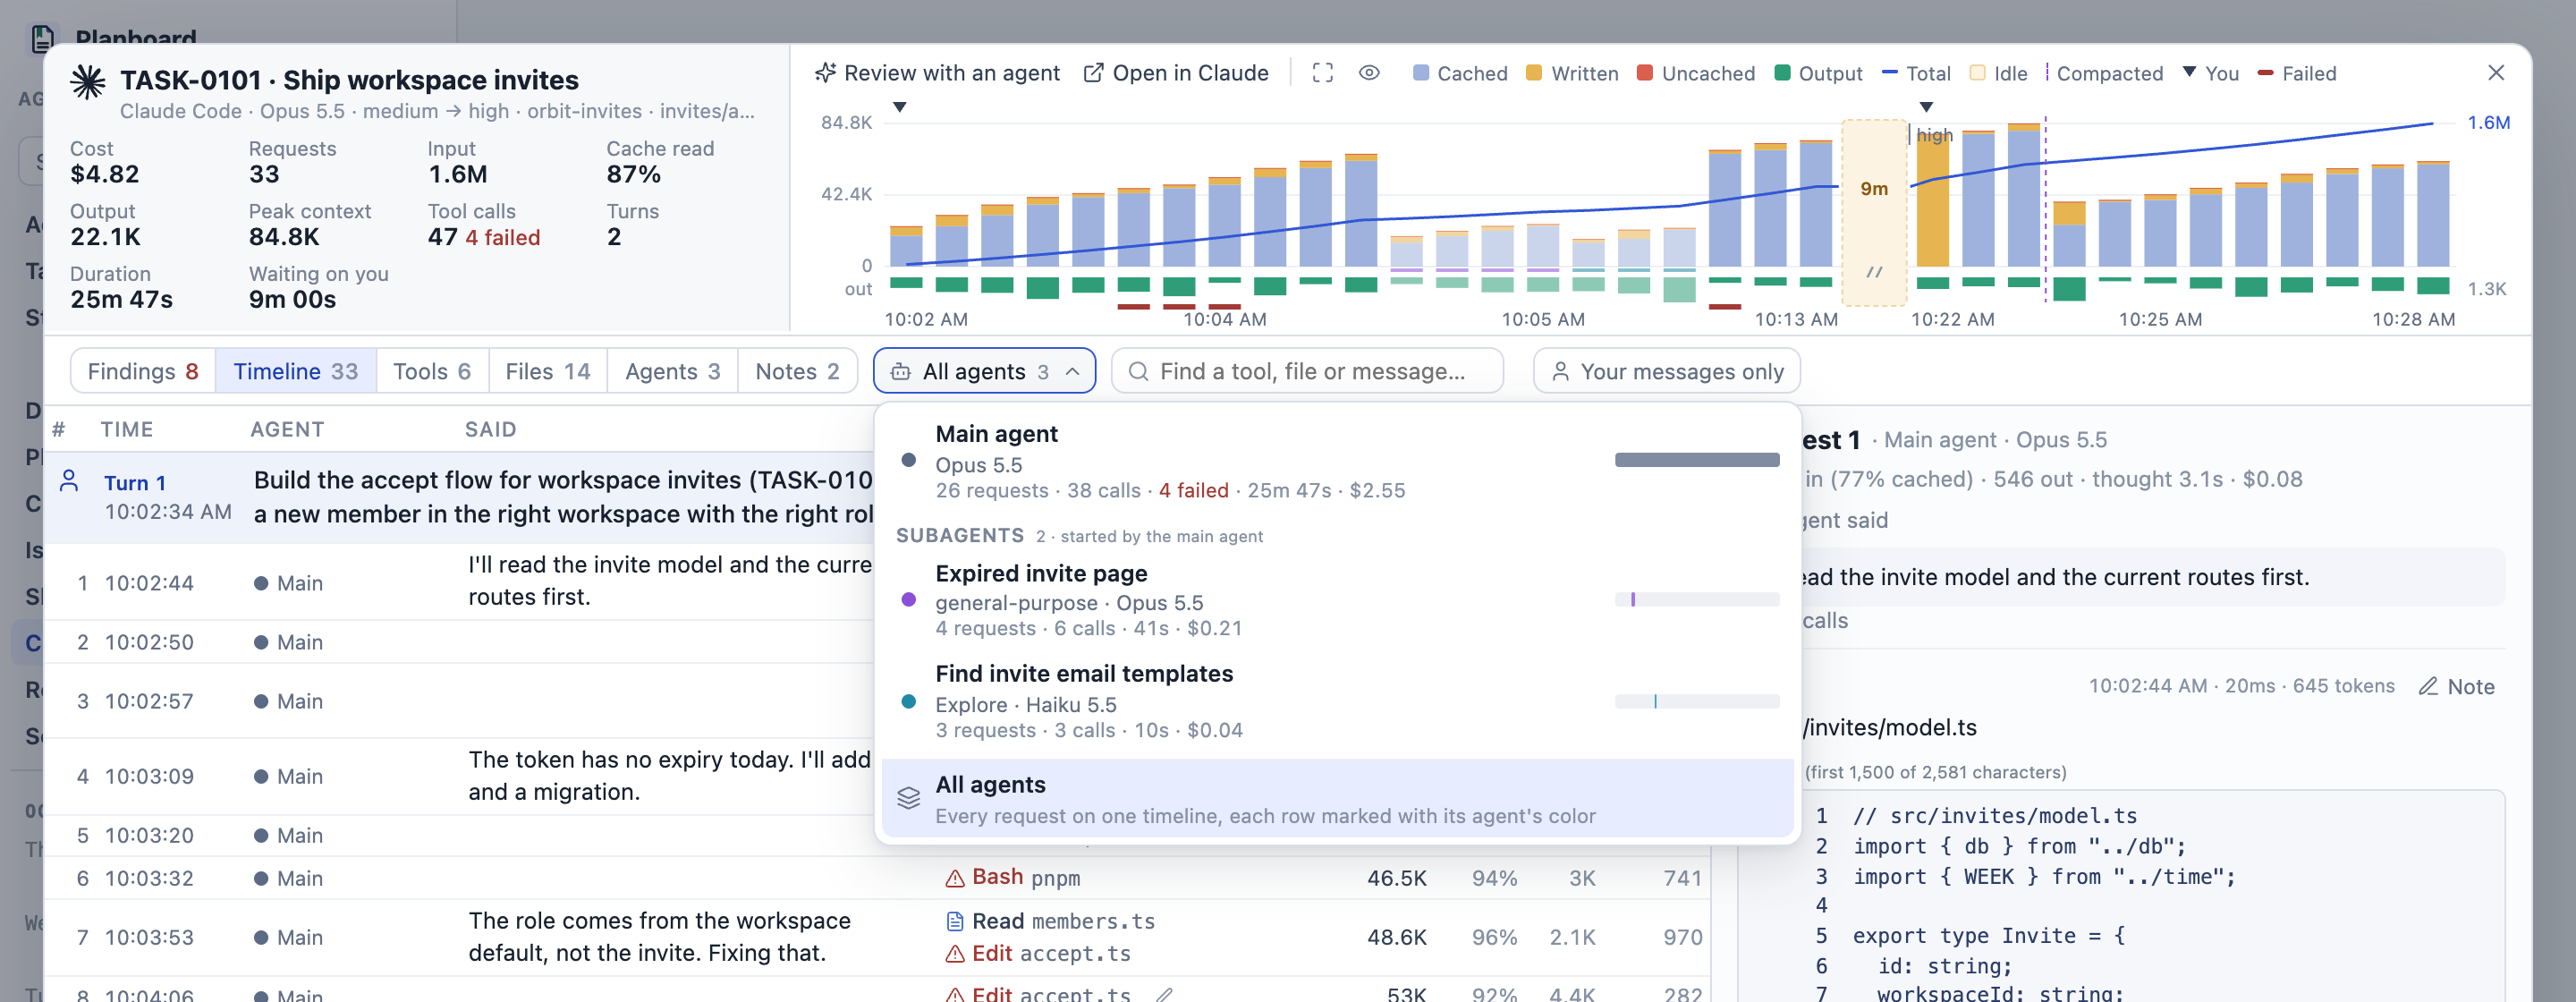
The agent picker was a native select with nothing but names. It is a menu now. Each subagent shows what it was started for, its kind and model, its requests, calls, failures, duration and cost, and a bar of when it ran on the session's clock. Each agent keeps its color in the menu, the chart and the timeline.
Readable shell commands
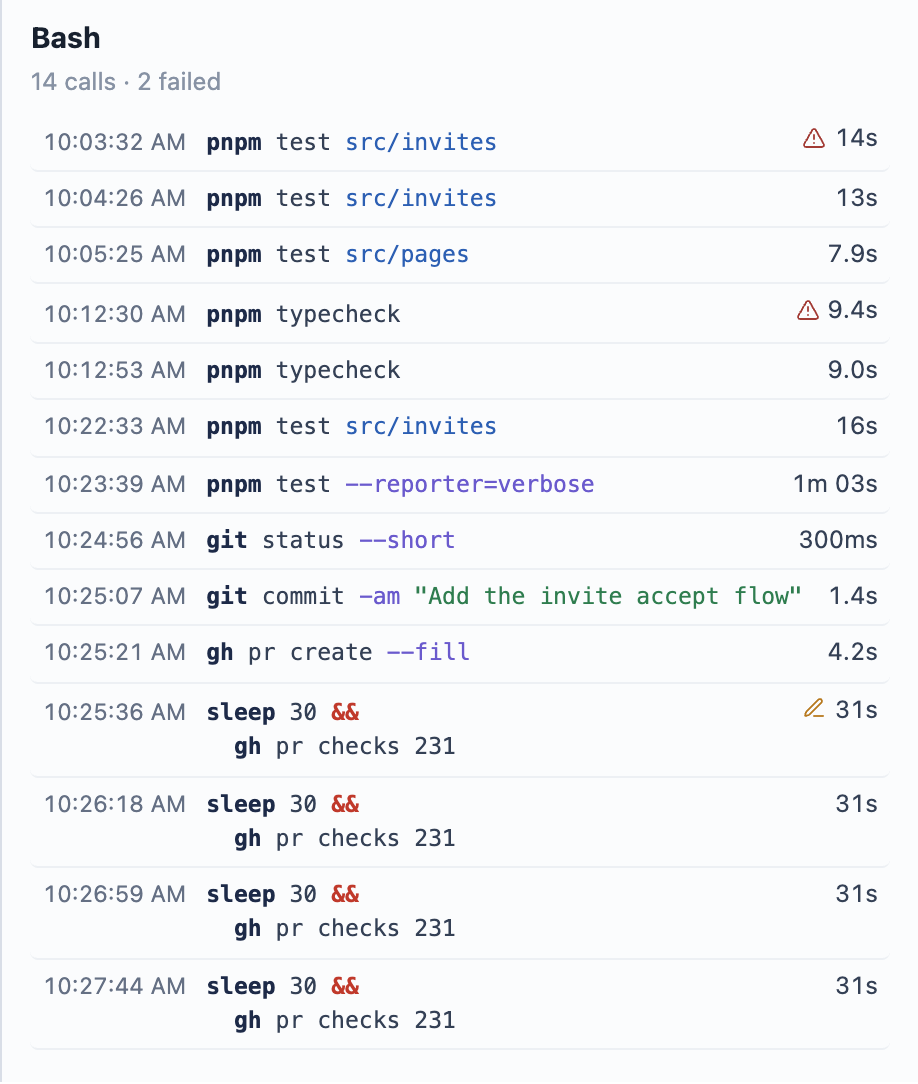
Agents write long one-liners like cd x && for d in …; do …; done; tail …. The overlay splits a command at its top-level ;, &&, || and |, indents loop bodies, and colors commands, flags, strings, paths and operators. The split never breaks inside quotes, $( ) or a heredoc, so it is still the same command. A heredoc's body stays plain text, so a Python script piped into python3 does not show up as a list of shell commands.
Previews instead of text dumps
Two of my screenshots had the same problem. A long agent prompt wrapped down a narrow column next to a tool name, leaving a big empty block. And a finding showed raw JSON arguments. I asked for the space to be used well, and for a short preview with a way to open the rest.
Each call in a list is now its time, then the tool above a two-line preview, then its duration. More opens the rest in place. A leading cd turns into "in change-lens-map" beside the tool, so both preview lines show the command. Finding details are cut to two lines, and calls are named by their command, file, pattern or title, never by JSON.
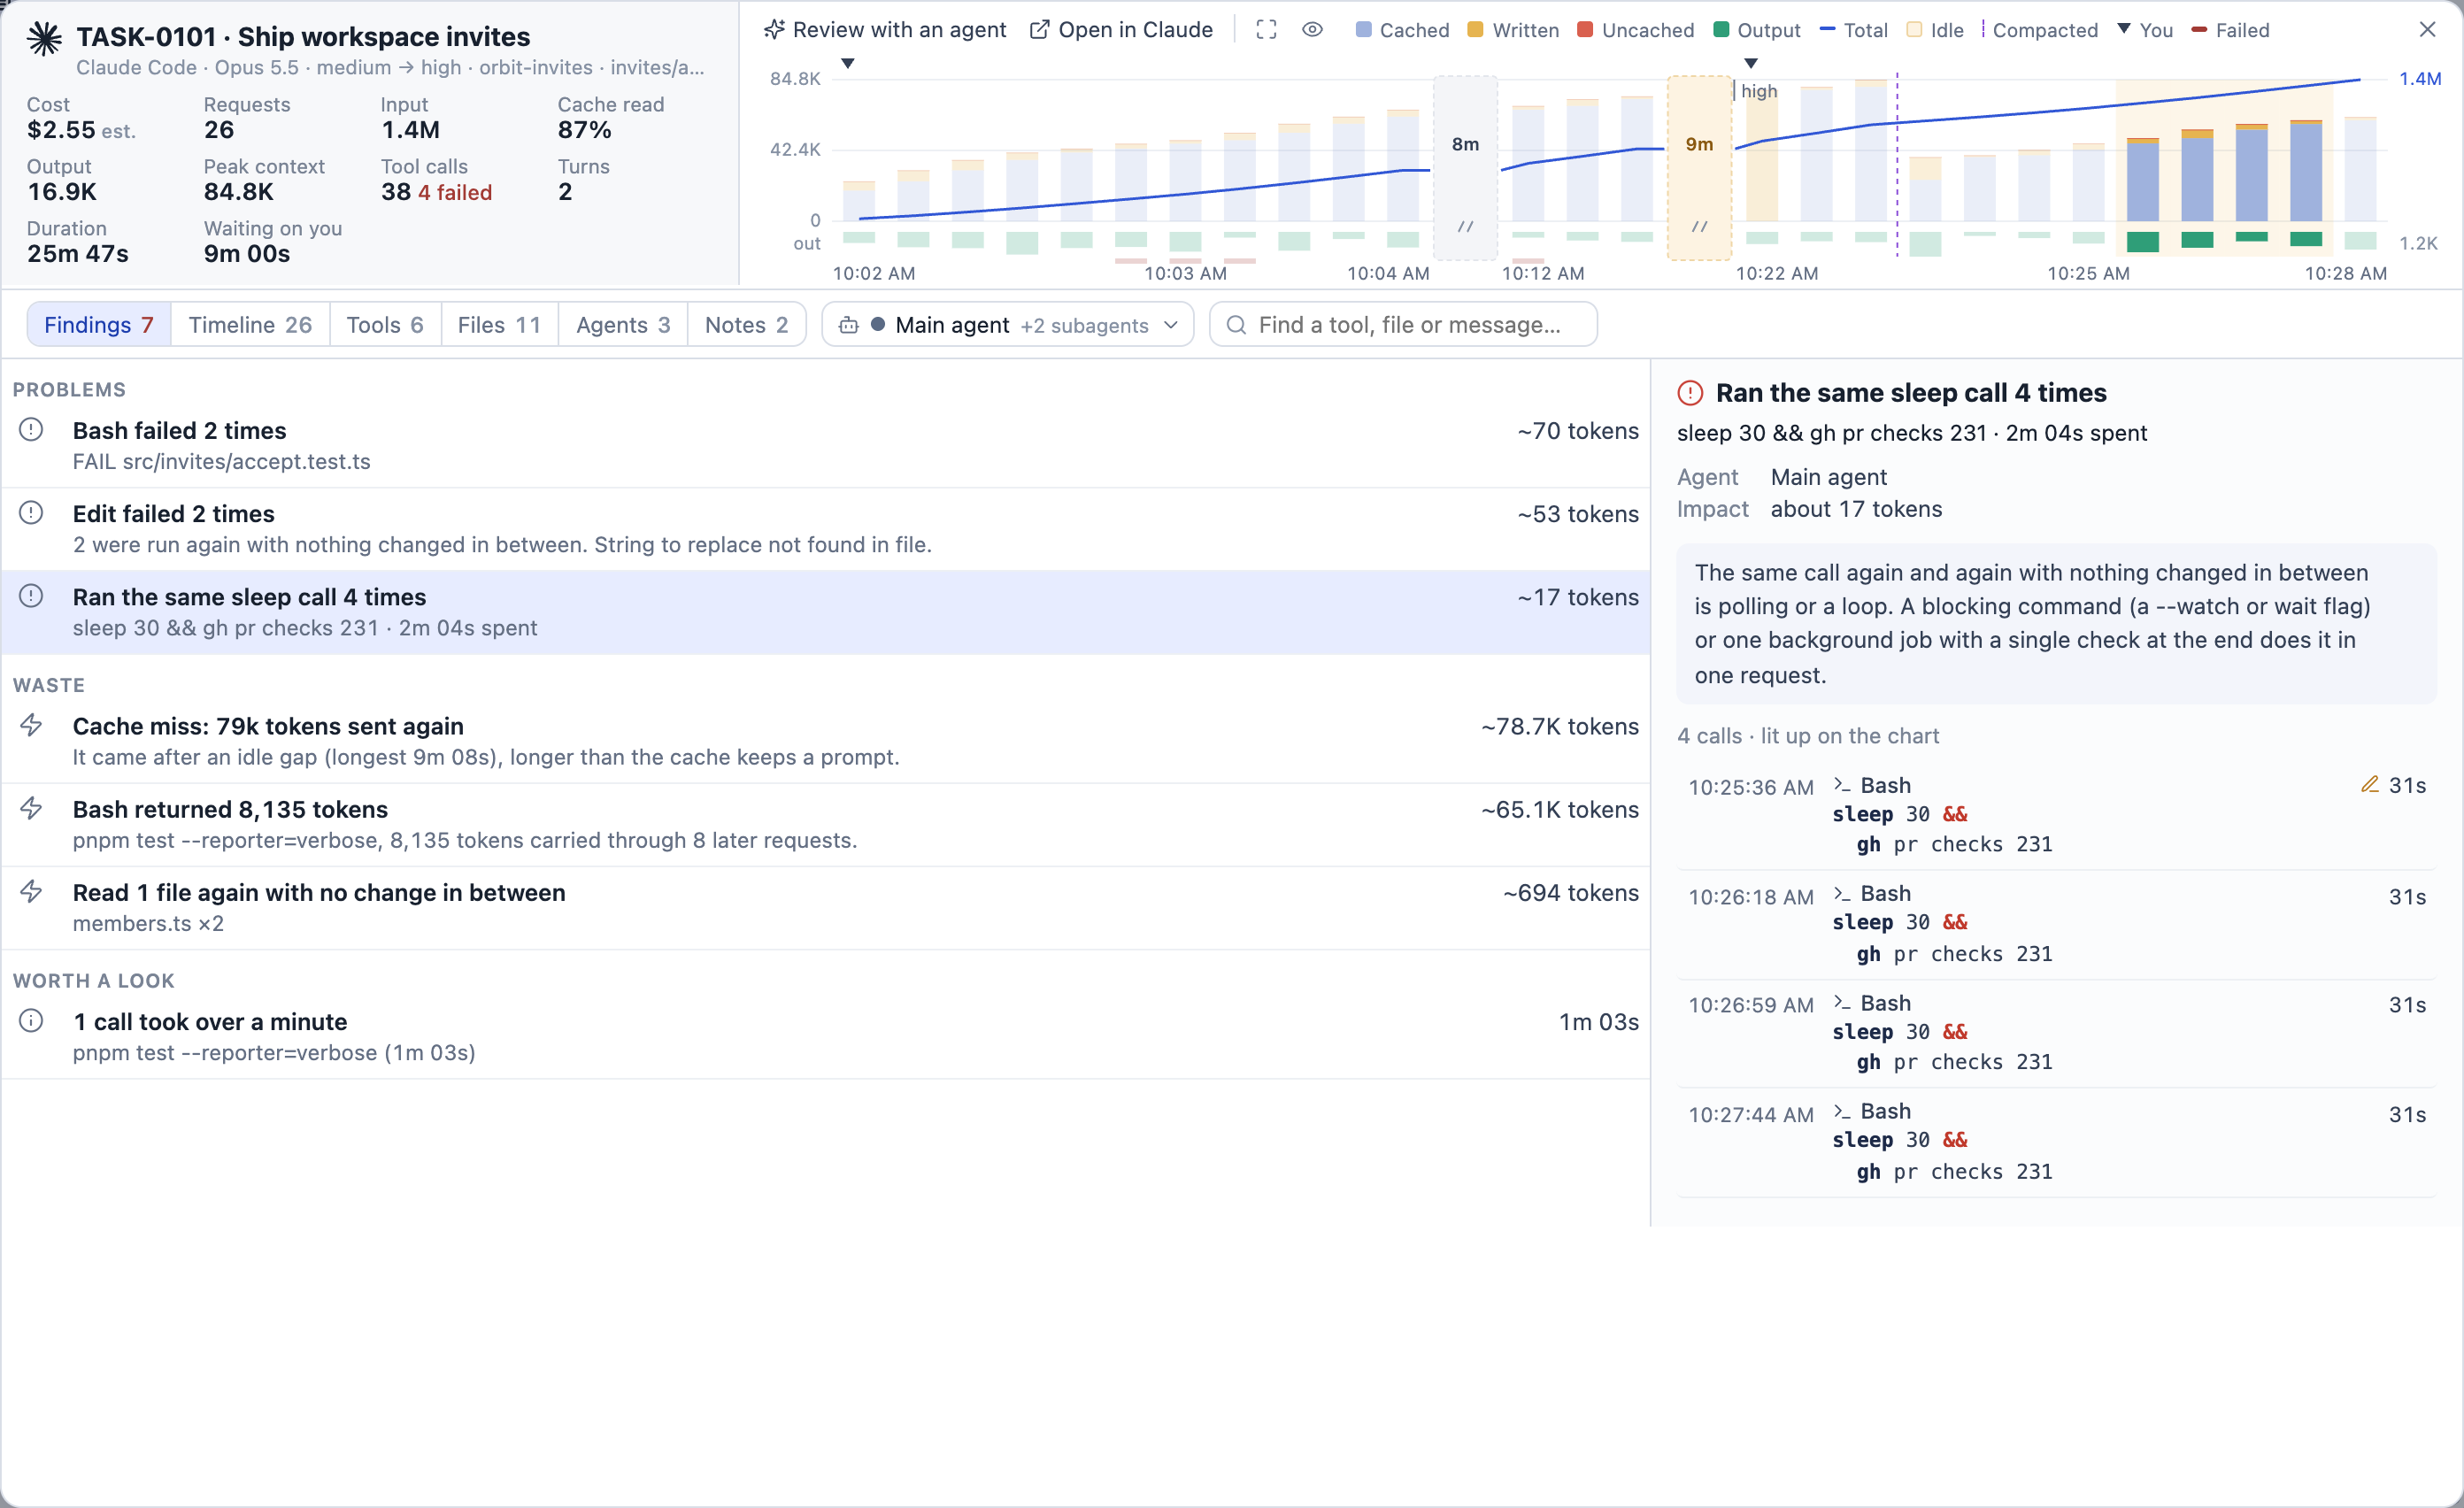
Selecting a finding lights its requests on the chart and tints them in the timeline. That used to be a lightning-bolt chip in the toolbar, and I said it looked misplaced and did not explain what it filtered. It now sits in the chart bar as "Highlighting …", next to what it highlights.

A 14-day session
The last round was a stress test. I opened a Codex session that ran a health-check automation for 14 days: 1,221 requests, 349 messages and 355 idle gaps. No screenshots for this one, because it is a real server's log.
It broke the overlay in four ways.
- Each idle gap took at least 22px. With 355 gaps that was more than the whole chart, so the bars collapsed and the labels piled up. Breaks now share at most a fifth of the chart. The longest gaps stay as breaks, and the rest become ticks on the axis. The clock labels add dates, and dense messages draw as thin ticks.
- The same polling check showed up as 20-some findings. Runs of one check now merge, even when the arguments vary a little: "Ran the same ssh call 723 times in 23 runs · 22 variants". That session went from 31 findings to 10.
- Codex runs commands inside JavaScript (
tools.exec_command({cmd: …})), so findings showed code. The overlay now reads the command out of it, also when the log cuts the arguments short. - Automation messages arrived as tagged text like
<heartbeat><automation_id>…. They now read as "Automation · coolify-demo-health-check", the agent's reply as "Quiet:" or "Notified:" with its message, and a repeated prompt takes one line marked "same as turn 6".
Clicking a row also rebuilt the whole 1,900-row list and the 1,200-bar chart, which took about 490ms. It now moves the highlight instead, in about 15ms.
What is still open
The gap threshold is a fixed 5 minutes. My sessions use the 1-hour cache, so many gray "cache held" breaks are real jumps in time that cost nothing. The other option is to break only when the gap is longer than the cache the session actually uses. Your messages only is not kept in the URL yet, so a refresh shows the full timeline again.