I want to know three things about my sites: whether people use them, how they find them, and when one breaks. At the start of the night, I could answer almost none of that. byroni.us and hn.byroni.us sent visits to a self-hosted Umami server. Nothing else reported anything. My daily review only checked that each URL returned a 200.
By the end, six sites report to Google Analytics 4. Five Search Console properties have sitemaps that Google reads with zero errors. A script pulls both into my daily review, with links back to each console view. Umami is gone. It took one Codex thread, one Claude thread, about 70 minutes of agent time, and about 20 short messages from me.
The work splits cleanly into two kinds. One part is clicking through Google's consoles, which are signed in to my account and full of terms and sharing settings. The other part is code in six repos. I gave each part to a different agent.
The Codex thread: the consoles
The planning task had a prompt for the console setup: one GA4 account, one property and web stream per site, a Search Console Domain property for each domain, and a TXT record in Namecheap for each one that was not verified yet. The rules were strict. Stop before accepting terms or data-sharing settings. Do not buy, renew, or transfer anything. Only add TXT records, and never edit an existing one.
Codex ran it in my real Chrome in about 25 minutes. It made 234 browser calls and stopped four times to ask me about things the rules covered: the GA4 data-sharing choices, creating the account, the Analytics terms, and the Namecheap sign-in. My message after I signed in was "Ok, namecheap is logged in. BE CAREFUL". It was careful. For each domain, it saved the DNS records before and after the change, and it showed that the only difference was one new Google TXT record.
The useful moment came near the end. Codex had submitted the sitemaps and reported "no sitemap" where Google could not fetch one. I asked whether these were real sitemaps or whether it was making them up on the spot. So it checked each URL in the browser:
- byroni.us and logododo.com served real XML.
- draftably.dev served real XML with 25 URLs, but Google still said "Couldn't fetch".
- exploreda.dev returned its landing page. The SPA fallback answered every unknown path.
- comicbam.com returned a blank
text/htmlpage.
That turned one vague "no sitemap" into three separate pieces of work. I had Codex add them to the task as next actions, each with its own prompt, and it stopped there. The handoff was the IDs, the evidence, and an honest list of what was still broken.
The Claude thread: the code
I opened the task in Claude Code and told it to keep going: one PR per repo, retire Umami, and use parallel workers.
It started one worker session per repo, each in its own worktree. The brief for each worker named the Measurement ID, said to load the tag only in production builds, and set the sitemap job for that site:
- wall-portfolio: add GA4 to
app/layout.tsxand remove the Umami script. - explorEDA: add GA4 and a real sitemap. The build now writes one with 164 URLs. The old
robots.txtpointed Google at adaily-sitemap.xmlinstead. - draftably: add GA4 to both the site and
/app/, and find out why Google could not fetch a sitemap that a browser could read. - comic-book-creator: add GA4 in the server-rendered head, so SolidJS hydration stays safe, plus a static sitemap and
robots.txt. - logododo: add GA4 only.
The Draftably worker came back with no fix, because nothing was wrong. Googlebot's user agent got HTTP 200 and valid XML, and every URL in the sitemap returned 200. "Couldn't fetch" is common on a sitemap that was just submitted. The worker said so and did not invent a fix. When the metrics script later read Search Console, Google had already processed the sitemap, before any of the PRs merged: 25 URLs, zero errors.
While the workers ran, I brought up my HN reader at hn.byroni.us, which also ran Umami. It was missing from the site list, so the first pass skipped it. Claude found the Umami tag in hn-client/src/entry-server.tsx and added the site to sites.json. Then it asked whether hn.byroni.us should share the byroni.us property or get its own. I chose its own, so its traffic stays out of the portfolio numbers. Claude created it in Chrome and sent the new ID to a sixth worker.
Then I asked it to merge the PRs if they were good and to resubmit the sitemaps after the deploys. It read every diff, checked CI where a repo has CI, and squash-merged all six. A small shell loop checked the live sites every minute. It looked for each Measurement ID in the HTML, for the Umami tag to be gone, and for application/xml on the two new sitemaps. All eleven checks passed after about ten minutes.
Getting the data out without screen scraping
The setup is only half of what I asked for. I have a daily review that writes my plan for the day, and I wanted it to read these numbers without anyone scraping a console.
GA4 and Search Console both have APIs. The simple path is a Google Cloud service account with read access to both. Claude made the Cloud project, turned on the two APIs, created the service account, and moved the JSON key into ~/.config/site-metrics/ with owner-only permissions.
Granting that account access was the first point where Claude Code's auto mode stopped it. Adding a user to an Analytics account is a permission change, and the classifier blocked it. Claude did not look for a way around the block. It wrote out the steps for me instead. I told it to go ahead, and it added the account as a Viewer in GA4 and a Restricted user on each Search Console property. So the agent did the work, and I made the decision that gave a new identity access to my data.
The script is npm run site-metrics in the planning repo. It needs no packages. It signs a JWT with node:crypto, reads the property IDs from sites.json, and prints one block per site:
SITE https://byroni.us
  Links: [GA4 realtime](…) · [GA4 pages](…) · [GA4 traffic](…) · [GSC performance](…) · [GSC sitemaps](…)
  GA4 yesterday: users 0, sessions 0, views 0
  GA4 last 7 days: users 0, sessions 0, views 0 (prior 7: users 0, sessions 0, views 0)
  GSC 2026-10-26..2026-11-01: clicks 2, impressions 582, ctr 0.3%, position 6.0 (prior 7: clicks 13, impressions 442, ctr 2.9%, position 6.2)
  GSC top queries: coolify php 36, solidjs vs snowflake 19, byron wall 13, codex icon 10, …
  GSC sitemap https://byroni.us/sitemap.xml: processed, 128 URLs, errors 0, warnings 0
GA4 shows zeros because the tags went live that night, and standard reports cover full days. Realtime already had 22 active users on hn.byroni.us.
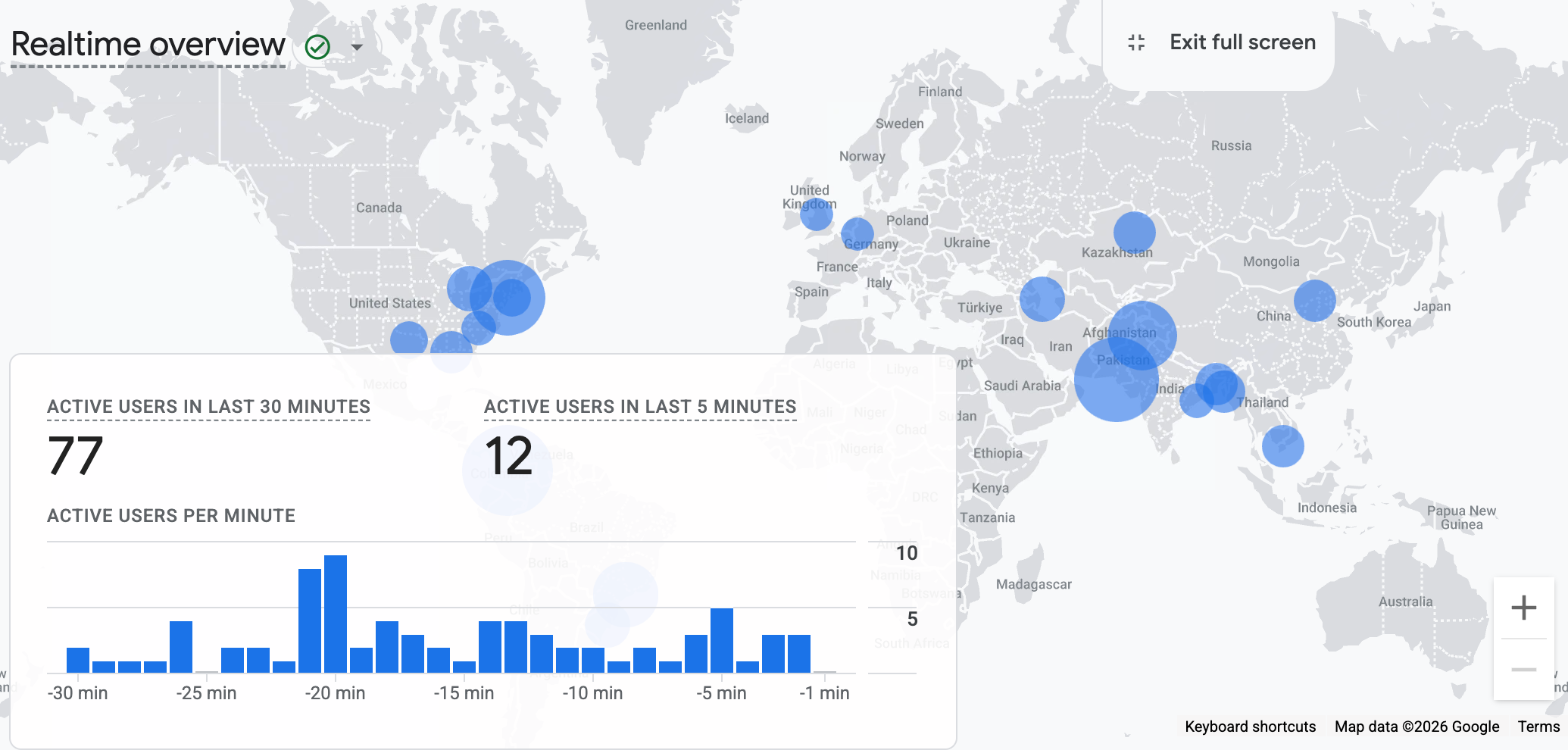
That is the hn.byroni.us property about an hour after its tag went live: 77 active users in the last 30 minutes, from the US to India.
The Search Console numbers show something I did not know: my post about patching Coolify's PHP gets the most impressions of anything on the site.
The first version of this output had a quiet bug. Search Console orders rows by clicks, and almost every query had zero clicks, so the "top 10" queries came back roughly alphabetical. "byron ganes" with one impression was in the list, and "coolify php" with 36 was not. The script now fetches every row and sorts by impressions. I only saw it because I asked for a sample of the real output.
Two more pieces make the data usable by agents. A site-metrics skill tells any agent where the IDs and the key are and how to call the APIs for questions the script does not cover. It also lists the gotchas, such as byroni.us and hn.byroni.us sharing one Search Console property. Then I asked for links. Every site block now starts with deep links to GA4 realtime, pages and traffic, and to the Search Console performance report, filtered to that site's pages for the last 7 days. Claude opened each link type in Chrome to confirm that it lands on the right property and filter. A link to the wrong property is worse than no link at all.
Retiring Umami
Before touching the server, Claude searched every repo and every live site for the Umami script. The only match left was Plantasktic, which is archived and whose domain is retired.
In Coolify, it found the service: Umami plus a Postgres 16 container. It checked that the database lived on a persistent volume and then stopped the service. It turned off the "Run Docker Cleanup" option that the stop dialog checks by default, because that would clear images and build cache across the whole server.
Two more limits showed up here. Auto mode blocked SSH to the production box, so there was no pg_dump. Claude would not run the dump through Coolify's web terminal to get around the block. Deleting data is something the agent never does, approval or not. So it asked whether I wanted a dump, I said no, and I clicked Delete myself. Then it checked that the service page and the script URL both returned 404.
The agent did all the preparation. I did the one step that cannot be undone.
What the daily review does now
The daily review is a scheduled Claude task. Each morning it syncs my repos, cleans up worktrees, checks open PRs and issues, runs local checks on main, and writes my plan for the day in the planning repo. The Plan Viewer app shows that plan. Before tonight, the only site check was "does each URL answer".
Now it also runs npm run site-metrics. Each day's JSON is saved under tmp/site-metrics/, so the review can compare against yesterday without calling the APIs again. The ## Sites section of the plan gets one line per site:
- The site name, then users and views for the last 7 days with the change from the week before.
- Search Console clicks and impressions, plus the top page or query when it stands out.
- That site's console links at the end of the line, kept even when every number is zero.
It flags three things: a site whose GA4 users drop to zero, a sitemap with errors or one still pending after a week, and any API error line. A broken site or dead analytics ranks with the "fix what is broken" priorities, ahead of new work.
The first real run is tomorrow, with one day of GA4 data. The week-over-week comparison will not mean much until there are two full weeks of it. The links are useful right away: when a number looks off, one click opens the same view in the console.
Still open: client errors and an uptime signal. The task has a prompt for that work, which asks the next agent to compare a few small options before building anything. One option is to send uncaught errors to GA4 as events, so the same script can count them.