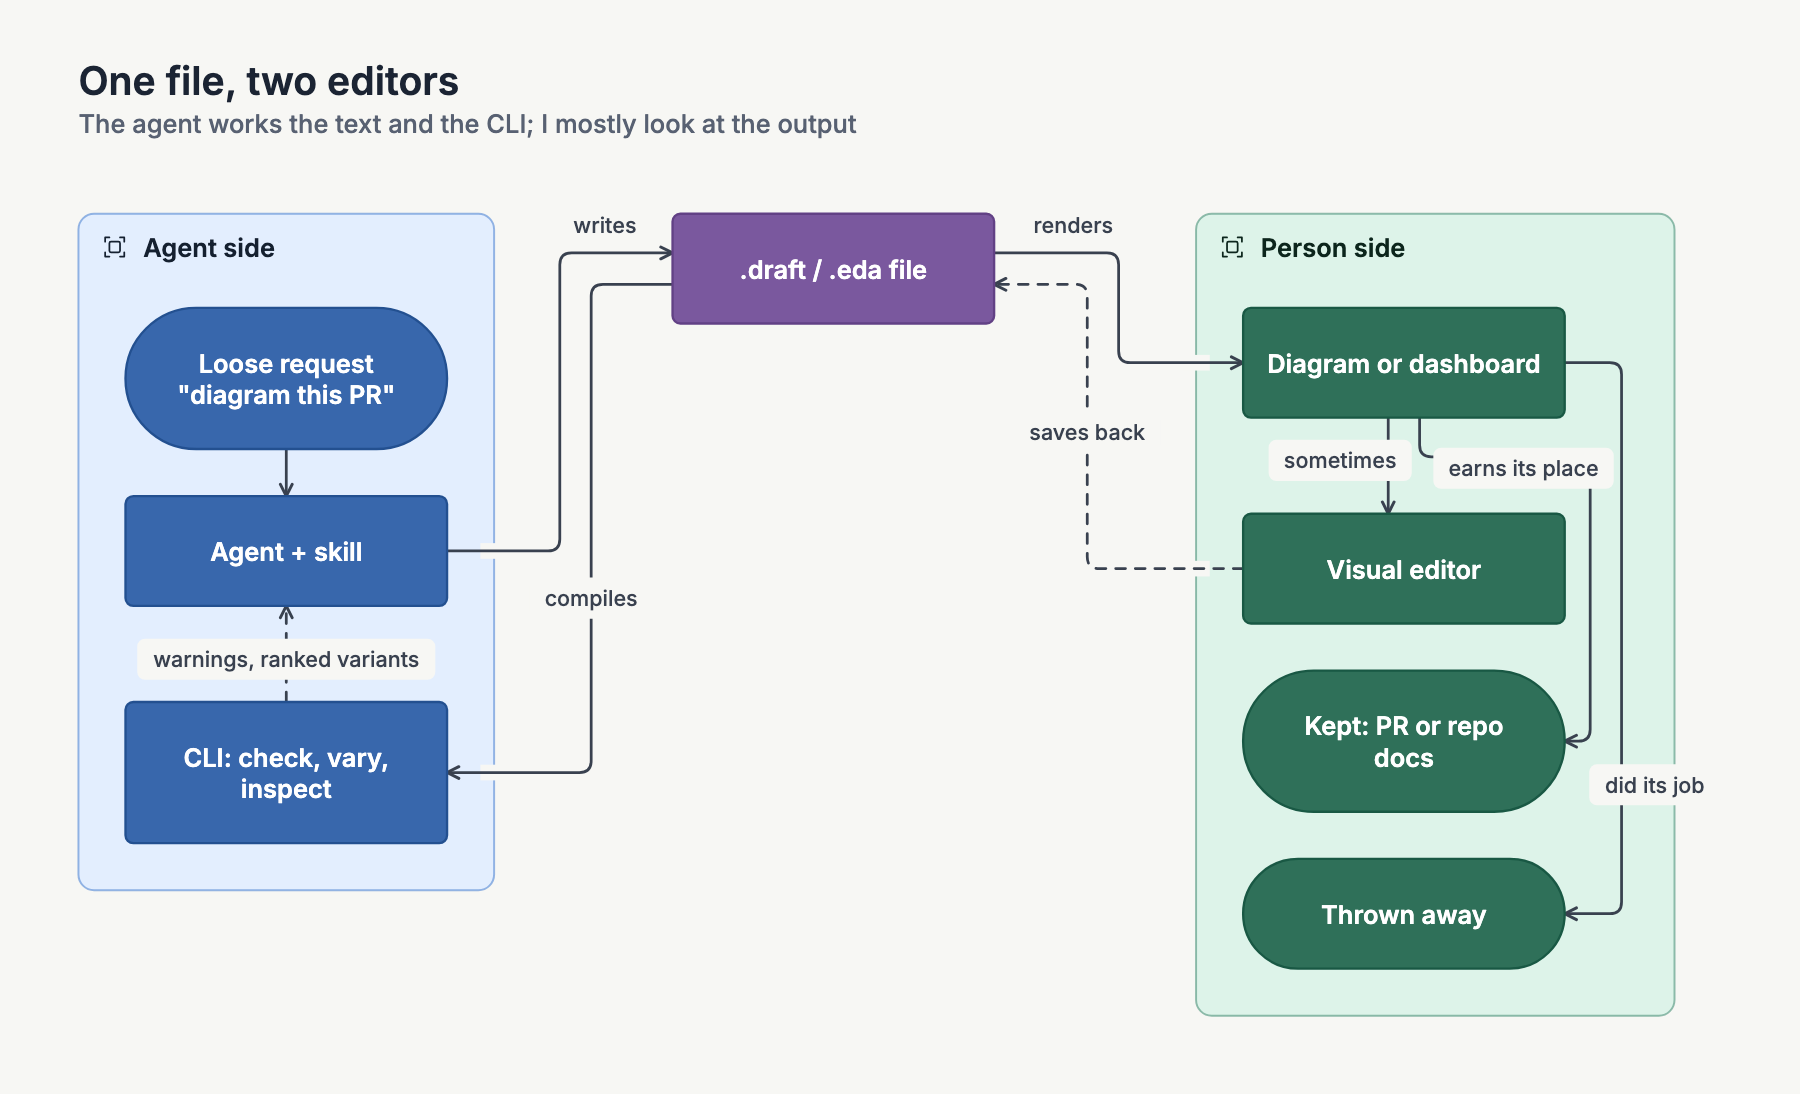
Two of my projects ended up with the same shape without me planning it. Draftably makes diagrams. ExplorEDA makes dashboards. Both have four parts:
- A small text format (a DSL) that holds the whole thing.
- A CLI that checks it, compiles it, and does the domain work.
- A skill and docs that teach an agent how to use the CLI.
- A visual editor where a person can see the result and change it.
My claim is that this combination is a very efficient interface for working with an agent. If you take a general-purpose domain like diagramming or dashboards, find a DSL for it, and put the tools and guidance around it, the agent can run the CLI, read the feedback, and edit the text, over and over, with a lot of options available to it. The person mostly deals with the output.
The DSL is for the agent
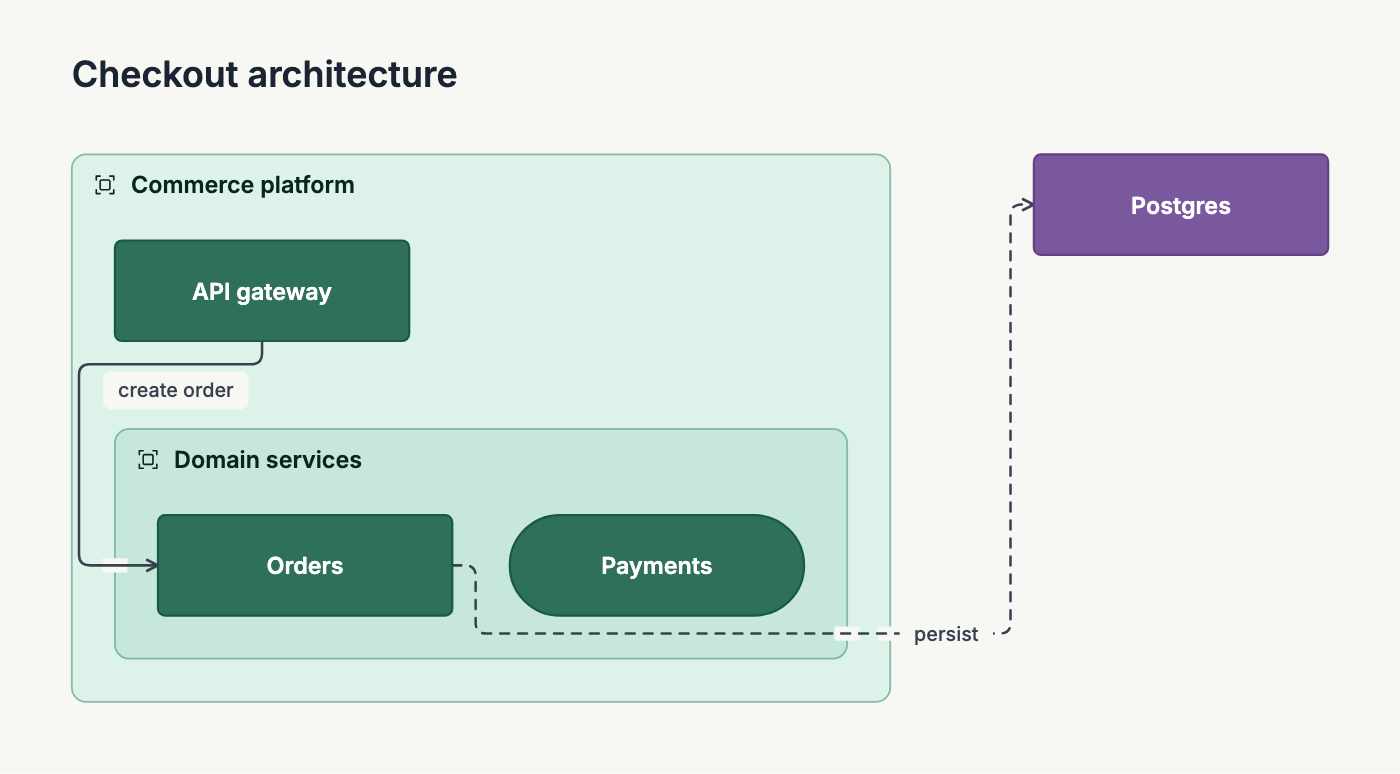
Here is a real Draftably file, from the diagram file docs:
diagram "Checkout architecture" version=1

group platform "Commerce platform" color=mint
node api "API gateway" in=platform
group services "Domain services" in=platform
node orders "Orders" in=services
node payments "Payments" in=services shape=pill
node db "Postgres" color=violet

edge dispatch api -> orders "create order"
edge persist orders -> db "persist" kind=async

layout root flow gap=48
layout services row gap=24
near payments orders side=right gap=32
That compiles to this:
And here is a real ExplorEDA dashboard, the earthquake depth piece from the daily collection. This is its .eda file, without the record table at the bottom:
eda query=events
dashboard "How deep do strong earthquakes start?"
grid columns=12 rowHeight=76
latitude:num=events.latitude label="Latitude"
longitude:num=events.longitude label="Longitude"
mag:num=events.mag label="Magnitude"
depth:num=events.depth label="Depth (km)"
band:cat=events.depth_band label="Depth band"
area:cat=events.area label="Area"
type:cat=events.mag_type label="Magnitude type"
map @db-earthquakes-depth-map color=band title="Earthquakes by depth" at=0,0,8,7 {
  latitudeField=latitude longitudeField=longitude sizeField=mag pointOpacity=0.5
}
row @db-earthquakes-depth-band band title="Select a depth band" at=8,0,4,3 x.title=Earthquakes
row @db-earthquakes-depth-area area title="Busiest areas" at=8,3,4,4 x.title=Earthquakes
hist @db-earthquakes-depth-hist depth bins=70 title="Earthquakes by depth" at=0,7,6,5 x.title="Depth (km)" y.title=Earthquakes
scatter @db-earthquakes-depth-mag x=depth y=mag color=band title="Depth and magnitude" at=6,7,6,5 x.title="Depth (km)" y.title=Magnitude
Seventeen lines, and this is what they turn into:
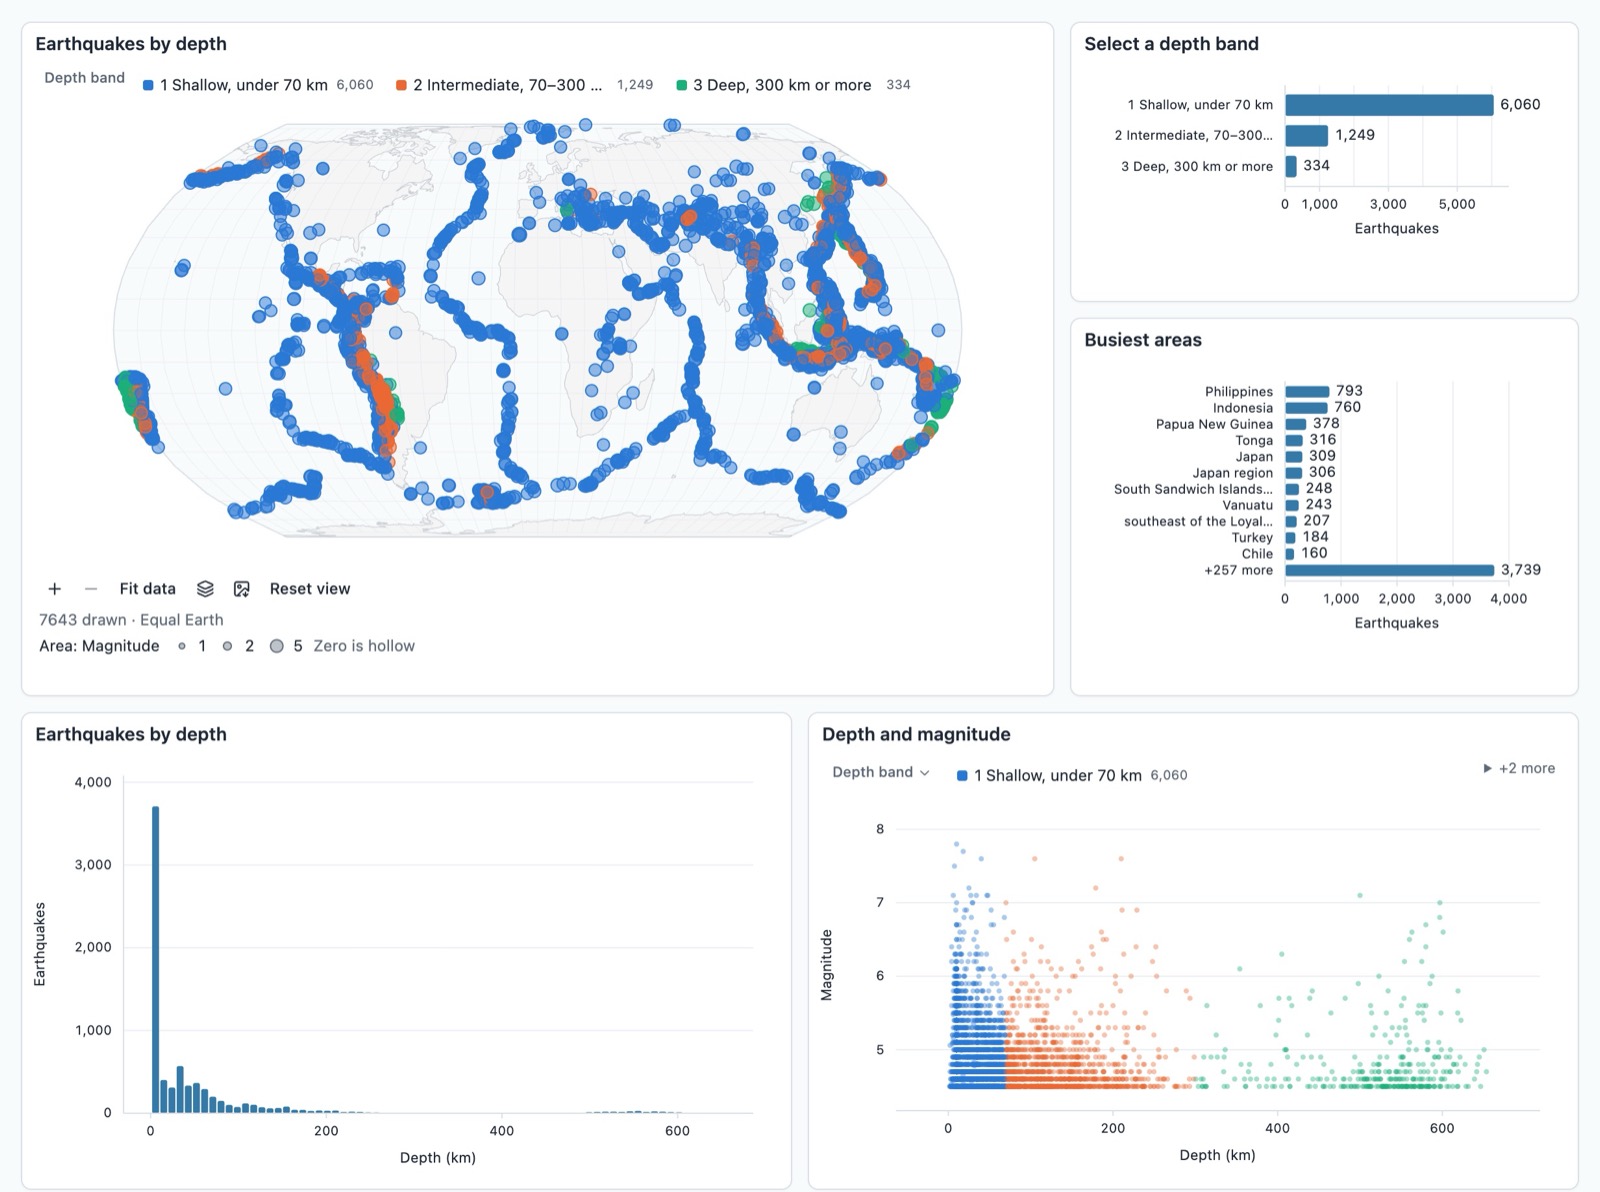
Both are readable. You can open one and tell what it will draw. But sitting there typing them by hand is tedious, and I don't do it. The agent can write this kind of text much faster than I can, and with higher quality. For the agent, the format gives just enough structure: one statement per line, IDs to point at, errors that name a line.
What I actually care about is the diagram or the dashboard. The DSL gives you a simple place to persist it and round-trip it. I probably look at about 1% of the DSL files that get written for me, and I pretty much never edit one manually.
The CLI is the real superpower
The DSL is good. The CLI is where the leverage is.
For Draftably, the clearest example is vary. It takes a file, tries other layout and routing settings that suit the diagram's shape, draws each one, measures it, and ranks the results on a contact sheet. This is the sample output from the docs:
$ draftably vary plan.draft
5 variants tried (3 kept). Sheet: plan.vary/contact-sheet.png
id  change               crossings  bends   size            warnings  moved  notes
v0  current              0          2       578×359         0
v1  compound-flow down   0          0 (-2)  292×539 (-24%)  0         162px  recommended, smallest, fewest bends
v2  compound-flow right  0          0 (-2)  810×254 (-1%)   0         169px  fewest bends
v3  data frame=soft      0          2       540×387 (+1%)   0         29px   least moved
Recommended: v1. Apply: draftably vary plan.draft --apply v1
That is a whole suite of heuristics the agent doesn't have to invent. Without it, the agent would spend its tokens thinking up alternative layouts, rendering them, and trying to judge which one is better. With it, the agent runs one command and gets ranked options back with numbers attached. The diagram at the top of this post went through the same step: vary tried seven variants, kept four, and said the starting layout was still the best one.
The skill is what ties this together. It teaches the agent one loop where every step is a command: write the file, check it, vary it, inspect the drawing, then open it for me. A person never has to learn that loop.
The editor is the escape hatch
So the starting point can be a loose instruction: "Use Draftably to make a diagram of this PR." That gives the agent the context. It uses the tools to put together a set of diagrams, and I never see the stuff in the middle, the DSL and the CLI runs.
If I do need to step in, I can switch to manual control. I pop into the editor and drag things where I want them. Those edits save back into the same .draft file the agent reads, so the next agent pass starts from my version. That is the round trip the DSL is for.
More often, though, the agent does it faster. If the agent plus the CLI gets you about 95% of what a human would get by fine-tuning and picking everything, the human stops feeling the urge to fine-tune. That depends on really good defaults: sensible spacing, strong opinionated themes and styles. Get those right and the output is good enough, and it came so fast that you are already on to the next thing.
Good output becomes disposable
That changes what a diagram is for. Very often the diagram is a stepping stone. It explains what the PR does so far. You look at it and see that something over there looks wrong. You go fix the actual system, make a new diagram, and that one looks right.
The diagram in the middle existed just long enough to show that something wasn't quite right. Then it got thrown away. The diagram is a representation of the system, and the system is what you fix.
Which ones do I keep? The ones that serve whatever I was originally trying to do. Usually that means a diagram in the PR so I can explain the change more simply to other people, or an architecture diagram that goes into the repo.
ExplorEDA is partway there
ExplorEDA points in the same direction, but it doesn't have this loop yet. It started as much more of a client and server app in the browser, not a CLI. It does have the text side now. Dashboard text compiles to the same settings the visual editor saves, and settings export back to text. On the published pieces, a Source button puts the file right above the live dashboard:
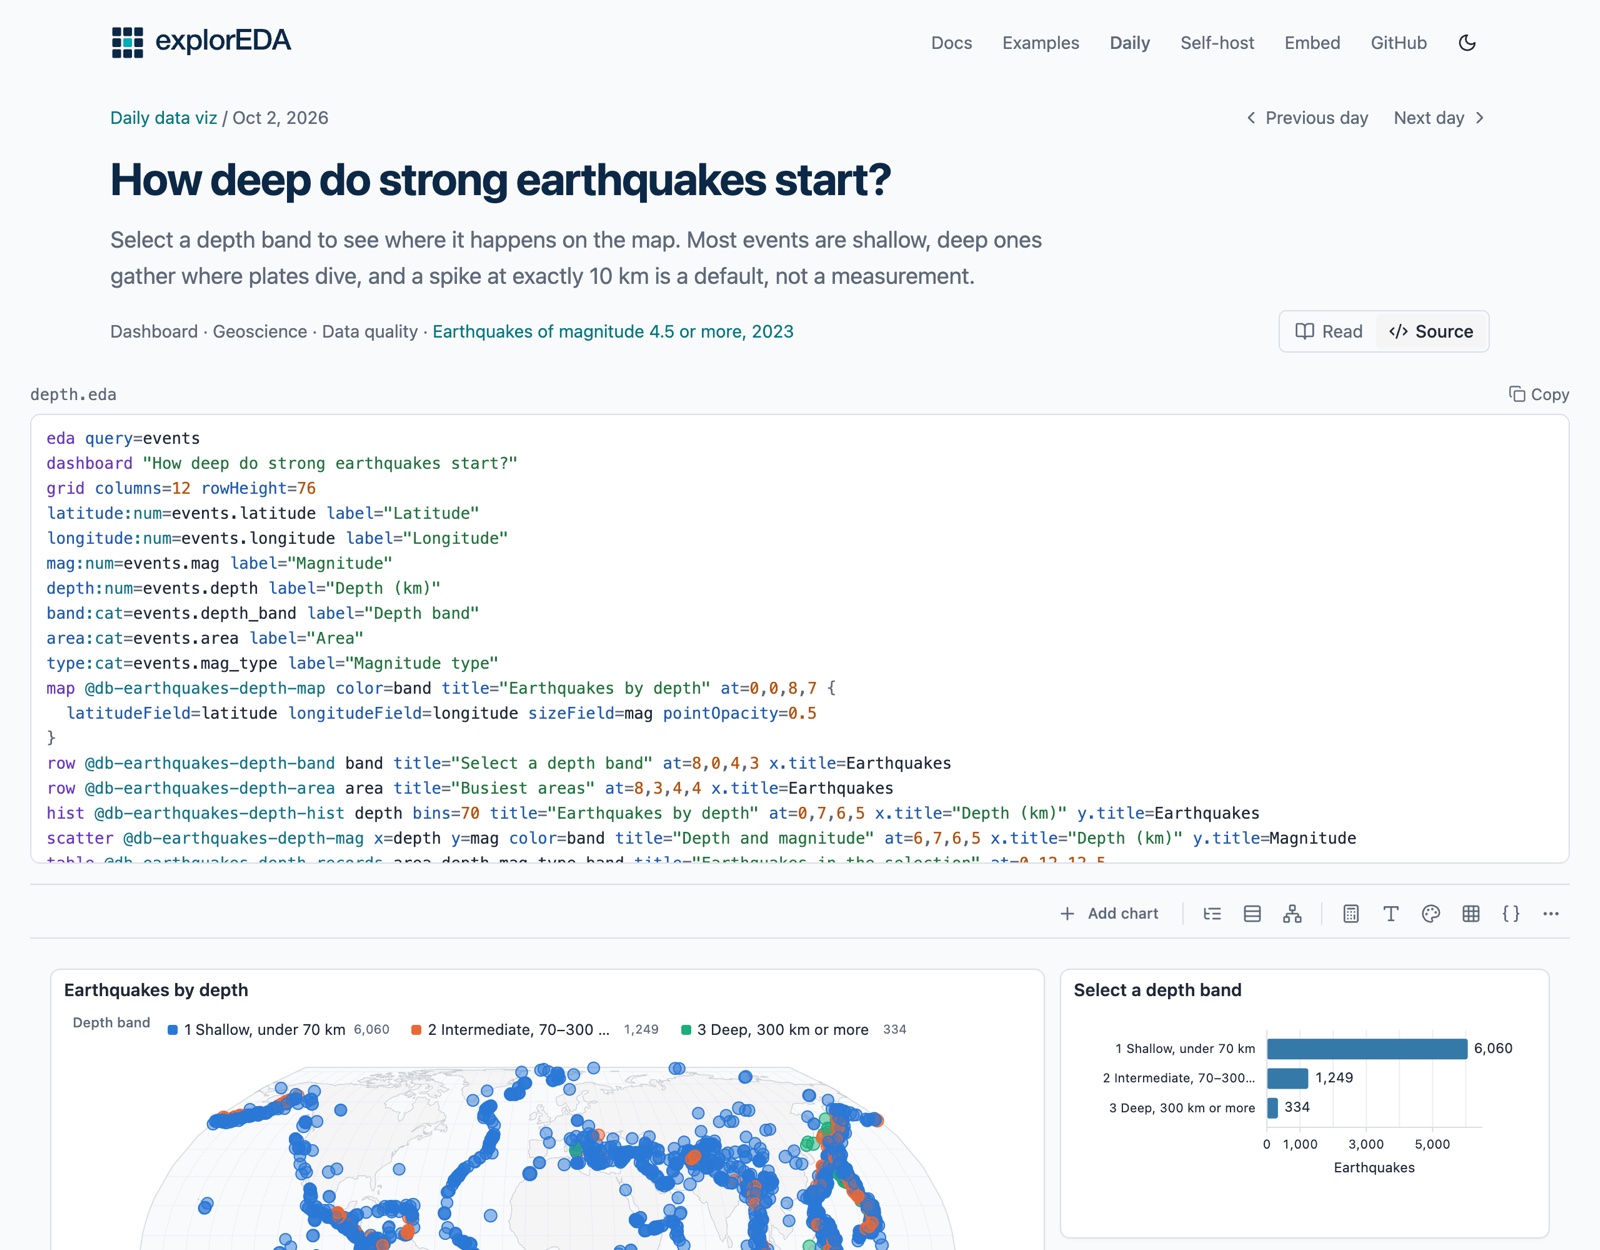
There is an exploreda-dsl command with check, fmt, and reference. What it doesn't have is a vary: nothing that generates alternatives and ranks them for the agent.
The goal is the same, though. If you want an agent to do a data analysis and produce a summary, a notebook or dashboard format lets it put that together much better than a person sitting there typing.
The open question: reach
All of this works when the agent can run the CLI. If you have Claude Code open, or a desktop agent, you can give it the thinnest prompt, "use Draftably to produce a diagram about X", and get a very good result.
If you are in ChatGPT on the web, it is trickier. The chat needs a way to reach Draftably, and there is no connector or hosted MCP server for it yet. It only exists on the desktop right now. A hosted connector is probably the next thing to look at. Until then, the loop belongs to the agents that can run commands on your machine.