A Draftably file says what a diagram means: nodes, groups, edges. A layout line says how to arrange it. The trouble is picking that line. You change flow to compound-flow, look, flip the direction, look again, bump a gap. One guess at a time.
That is slow for me. It is worse for an agent. An agent edits the file, runs check, and gets back "OK." It has no idea whether the picture got better, so it either stops at the first layout or keeps editing lines blind.
So Draftably now does the guessing. draftably vary reads the diagram's shape, tries the layouts that suit it, draws and measures each one, and ranks them against the file as it is. The editor's Compare sheet does the same thing with the same rule.
Before I explain the rule, try it yourself. This is a real vary run on the observability example that ships with Draftably. v0 is the file as it is.
draftably vary observability-stack.draft
Which layout would you keep? Click one.
The prettiest one lost
The obvious pick is v2. It has zero crossings and 13 fewer bends than the original. It reads top to bottom with no wires tangled across the middle.
vary recommends v1 instead, a router setting that removes one crossing and moves nothing.
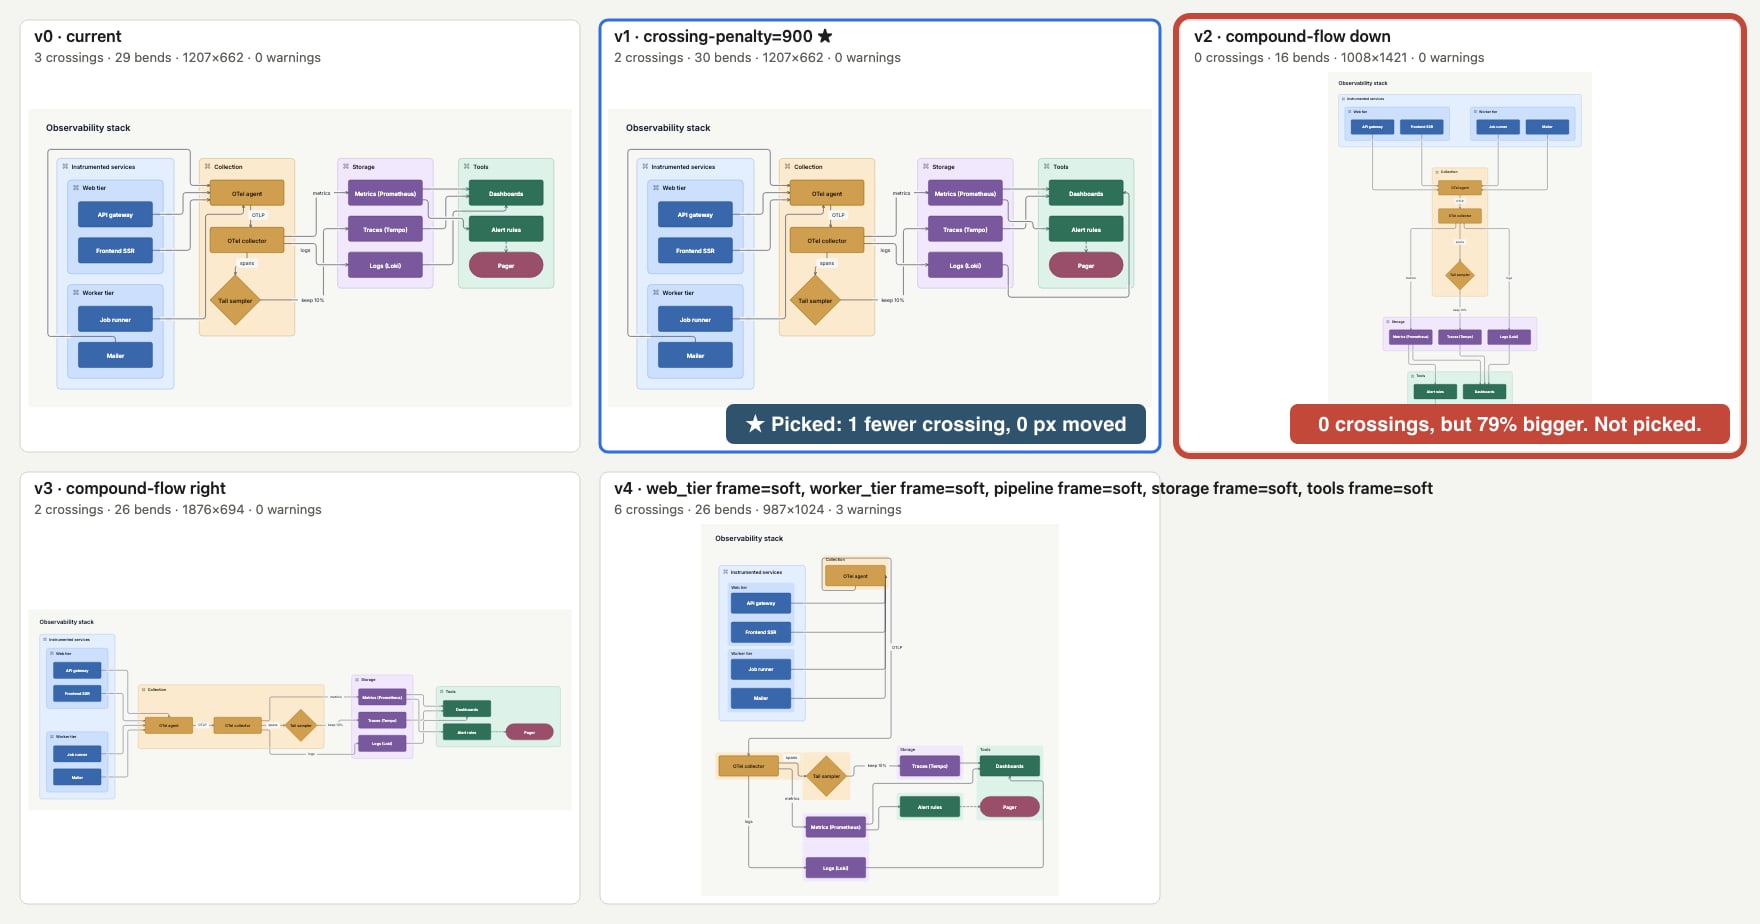
v2 is 79% bigger, and the average box moved 622 px. It is a different diagram. Maybe a better one. But "better" there is a trade: fewer crossings for a lot more canvas. The tool will not make that trade for you.
The rule is in improves(), and it is short:
- A variant with more warnings or more crossings than the file never wins.
- Fewer warnings with no more crossings always wins. A conflict outweighs room.
- Otherwise it has to be no bigger, and better on crossings or area.
Only a variant that passes is recommended. If none does, the recommendation is v0, which means keep what you have. The scatter under the explorer below shows this directly: the shaded corner is "no worse on crossings or area." Dots in that corner can win. Every dot outside it is a trade.
What it tries and what it measures
vary does not try every engine with every setting. It reads the diagram first (#159):
| The diagram has | vary tries |
|---|---|
| Groups | compound-flow, reading right and down |
| No groups | layered, reading right and down |
| A long chain | flow, kept on one line |
| A tree with one start | tree |
| Long edge labels | a wider rank-gap |
| Crossings | the same layout, with a router that avoids crossings harder |
| Leaf groups | fewer containers: frame=soft |
Each variant is compiled, routed and drawn exactly as the CLI draws it, then measured: crossings, bends, canvas size, the warnings check would print, and moved, the mean distance a box moved from where the file draws it. Repeats that draw the same picture are dropped. The run is deterministic, so the same file gives the same variants.
The output is one image with every variant as a tile, a PNG per variant, and a table:
$ draftably vary observability-stack.draft
6 variants tried (4 kept). Sheet: observability-stack.vary/contact-sheet.png
id  change                crossings  bends     size              warnings  moved  notes
v0  current               3          29        1207×662          0                smallest
v1  crossing-penalty=900  2 (-1)     30 (+1)   1207×662          0         0px    recommended, smallest, least moved
v2  compound-flow down    0 (-3)     16 (-13)  1008×1421 (+79%)  0         622px  fewest crossings, fewest bends
v3  compound-flow right   2 (-1)     26 (-3)   1876×694 (+63%)   0         300px
v4  web_tier frame=soft, worker_tier frame=soft, pipeline frame=soft, …  6 (+3)  26 (-3)  987×1024 (+26%)  3 (+3)  322px
Recommended: v1. Apply: draftably vary observability-stack.draft --apply v1
--apply writes only the lines that variant changes and keeps comments, IDs and refinements. Then it runs check.
Six runs, six answers
Here are all six runs, including the one above. Switch between them, hover a tile or a dot, and change --prefer.
v1 No worse anywhere, and 1 fewer crossing. A safe change.
The shaded corner is “no worse on crossings or area.” Only dots inside it, with no new warnings, can be recommended. Everything else is a trade.
The other five each show a different side of the rule.
Data lakehouse: a win without moving anything. crossing-penalty=900 takes 4 crossings to 2 and moves 0 px. This is the best kind of result. The picture you already know, a little cleaner. But switch --prefer to Smallest first and the star moves to v2, which softens the group frames and is 27% smaller with the same 4 crossings. Both pass the rule. --prefer only decides which safe change comes first.
RAG assistant: keep what you have. Three alternatives each remove one crossing, but each one grows the canvas by 8 to 46%. None passes, so the recommendation is v0. "No change" is a real answer. An agent that gets v0 back knows to stop.
AWS VPC: the bends trap. Softening the subnet and region frames takes bends from 21 to 7. That tile looks much quieter. It also adds 7 crossings and 2 warnings. This is why bends rank but do not gate. A drawing with fewer bends is not better if lines now run through things.
Kubernetes cluster: the big shrink. Reading down is 40% smaller and passes the rule. It also moves the average box 533 px. If someone already knows this diagram, that matters. Least moved first picks v2, which is 1% smaller and moves boxes only 87 px.
The last tab is a diagram from this post. It gets its own section.
Telling it what you want
The defaults are crossings first, then area. Agents get more control with flags (#160, #162, #192):
--fit wide|slide|square|page|tallaims for an image shape and ranks closeness to it right after warnings.--prefer fewer-crossings|compact|stablesets the order after warnings.--try engine=layered,treetries exactly those values. A second--trymakes a grid.--gridsweeps the main engines in both directions.--scope <group>varies one group's layout instead of the root's.--from v2searches around a variant from the last run.--budget 60sstops trying after a minute and ranks what it found.
--fit has one rule I like. Ask the observability run for a tall image, and v2 is now marked best fit. It is still not recommended:
$ draftably vary observability-stack.draft --fit tall
id  change                       crossings  bends     size              aspect  warnings  moved  notes
v0  current                      3          29        1207×662          1.82    0                smallest
v1  crossing-penalty=900         2 (-1)     30 (+1)   1207×662          1.82    0         0px    recommended, smallest, least moved
v2  compound-flow down           0 (-3)     16 (-13)  1008×1421 (+79%)  0.71    0         622px  fewest crossings, fewest bends, best fit
…
With --fit, a variant can grow to reach the shape, but by half at most. Reshaping the same content should not need more than that. Growth past that point is empty space, not a better fit.
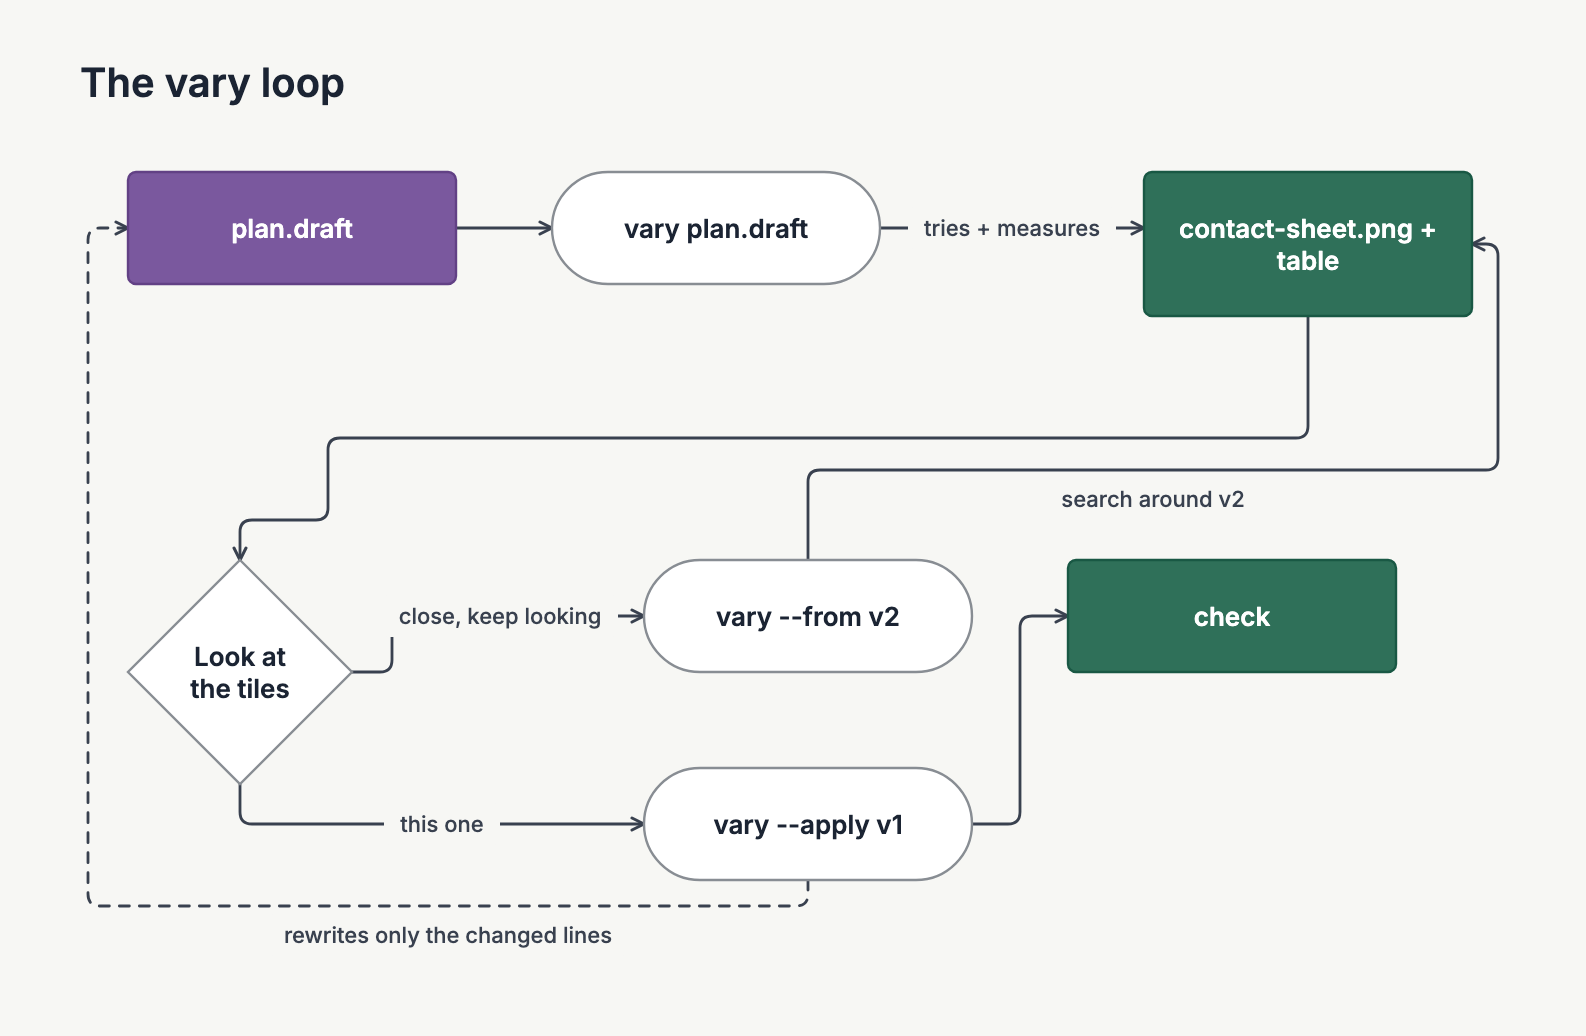
The loop an agent runs looks like this:
The rule on its own diagram
That loop diagram was messy the first time I drew it. Three crossings, and the dashed "rewrites only the changed lines" edge cut straight through the "keep looking" label. So I ran vary on it.
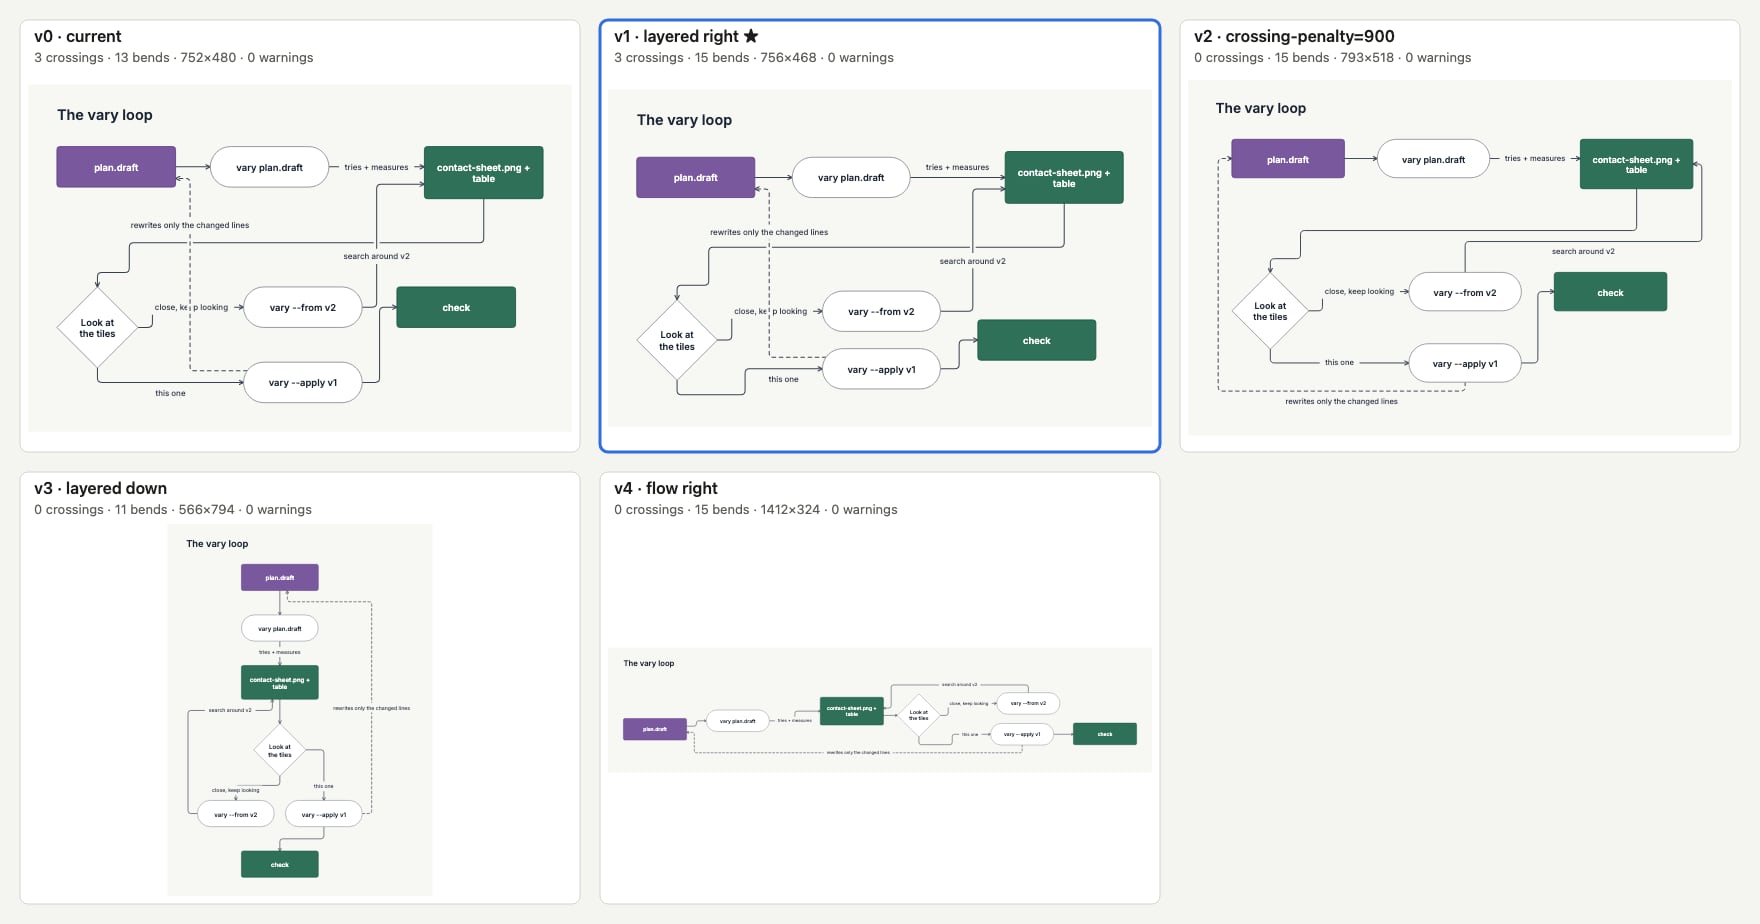
The recommendation was v1: the same 3 crossings, 2% smaller. Every other variant removed all 3 crossings, but each one grew the canvas by 14% or more. So by the rule, v1 was the only safe change.
v1 is not the best tile. v2 is the same layout with the stricter router. It has 0 crossings, nothing moved, and 14% more room. I looked at the sheet, took the trade, and ran vary --apply v2. That is the version in the previous section.
Two things to note from this. First, the rule did its job. It found the safe change and showed me the trades next to it, and the trade was mine to make. Second, the table said v1 had 0 warnings, even with a line through a label. check's label rule looks for a label over a box or another label. It does not catch a line through a label. The editor's Compare sheet has counted that case since #393. The CLI does not yet.
The same rule in the editor
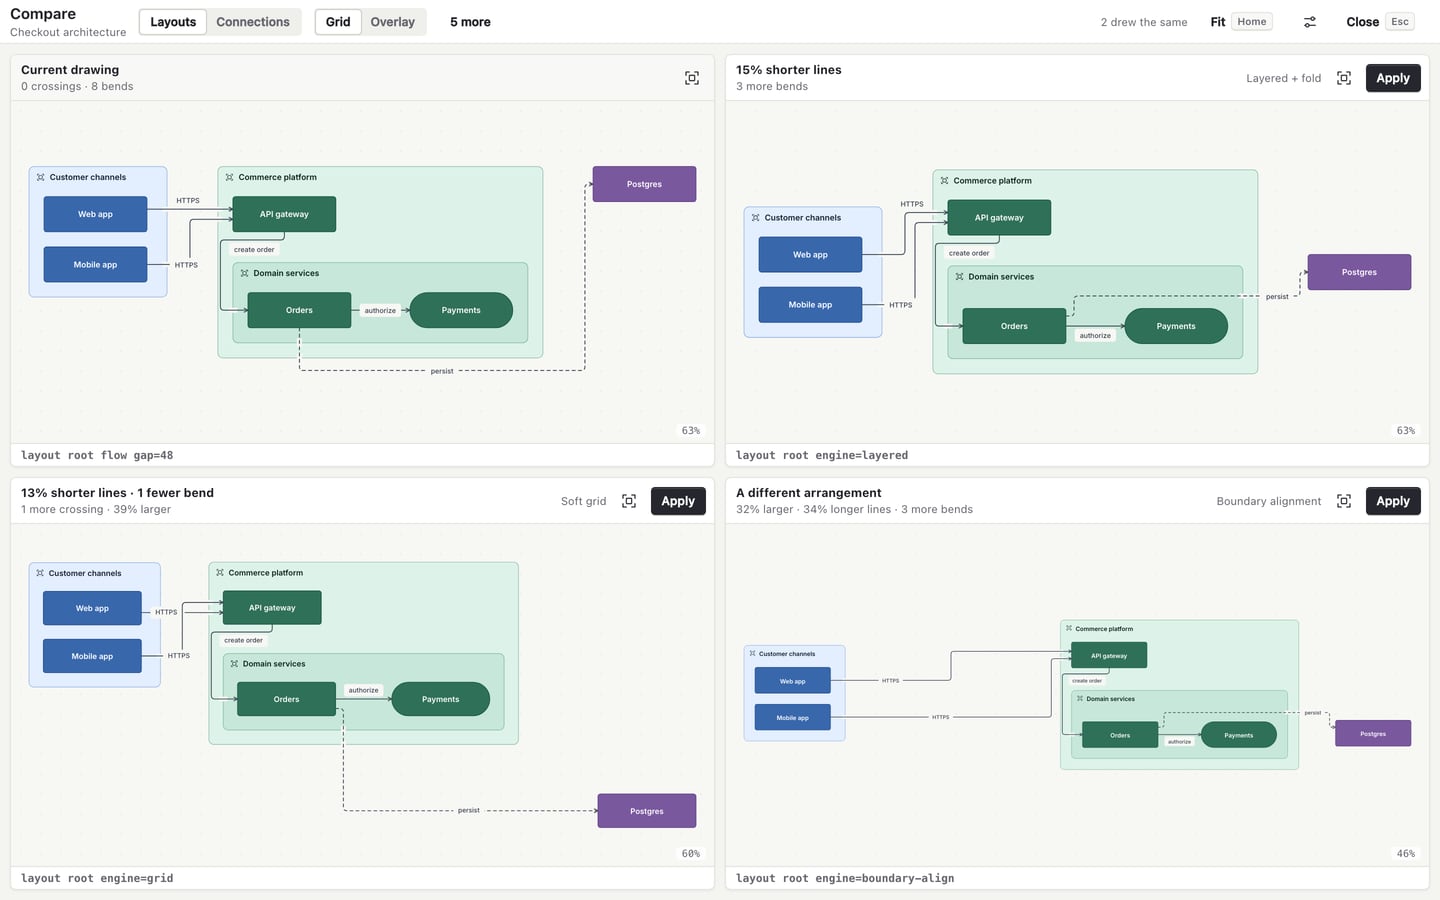
The Compare sheet in the editor used to show six cards that were hard to tell apart, with no current drawing to judge them against:
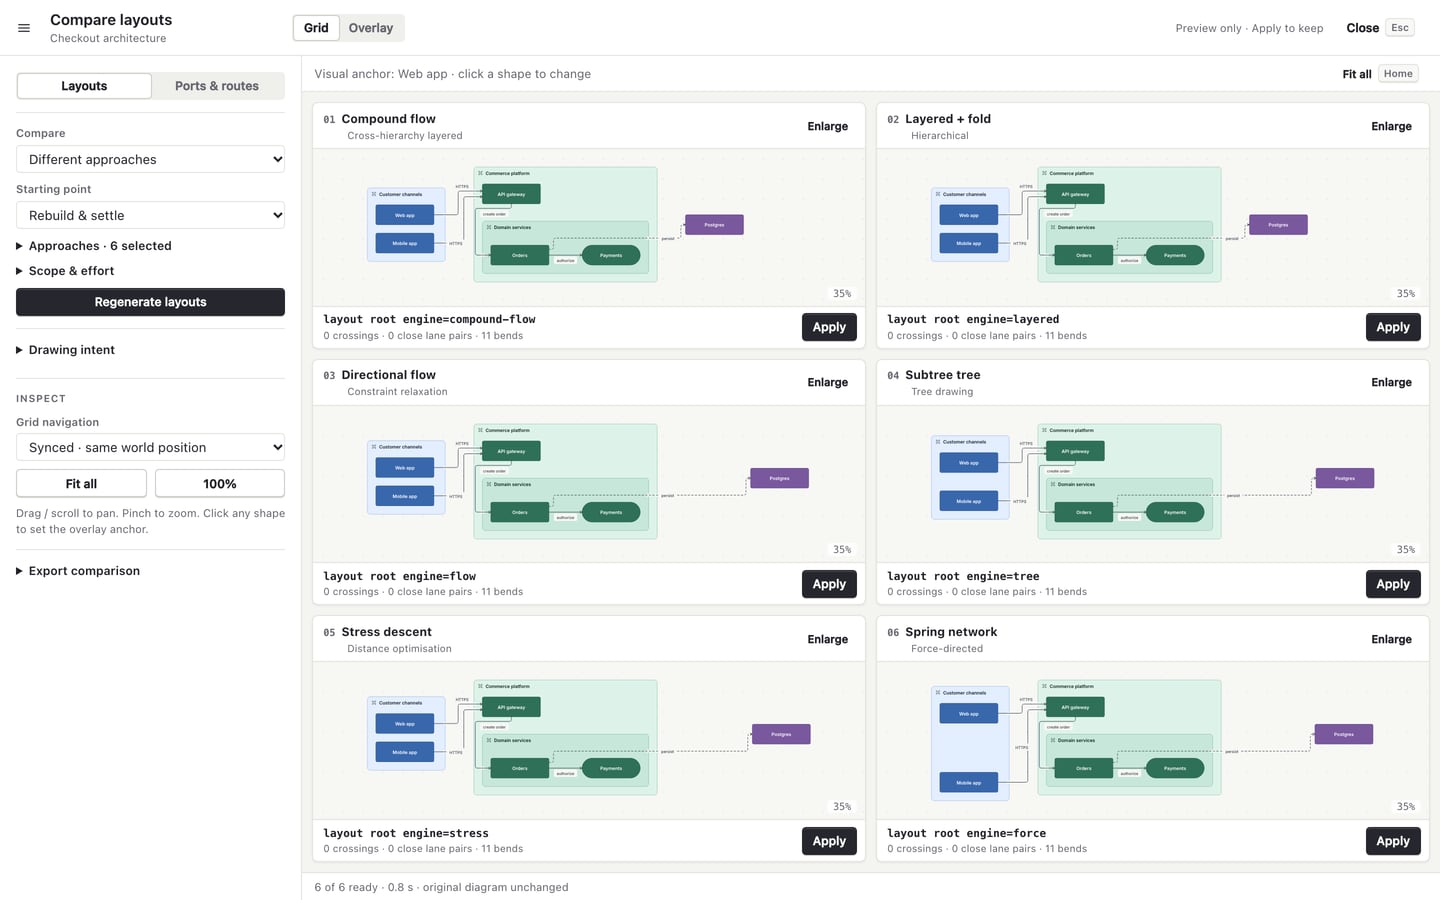
Now it opens on Current drawing and up to three alternatives that really differ (#379). Each card leads with a measured gain, such as "15% shorter lines," and lists its cost below it. A card with no gain says "A different arrangement." Repeats are dropped, and the header says how many.
The costs are what make it useful. Here is a denser diagram partway through a run. The top-right card has 1 fewer crossing and 5 fewer bends. It is also 165% larger, and the card says so:
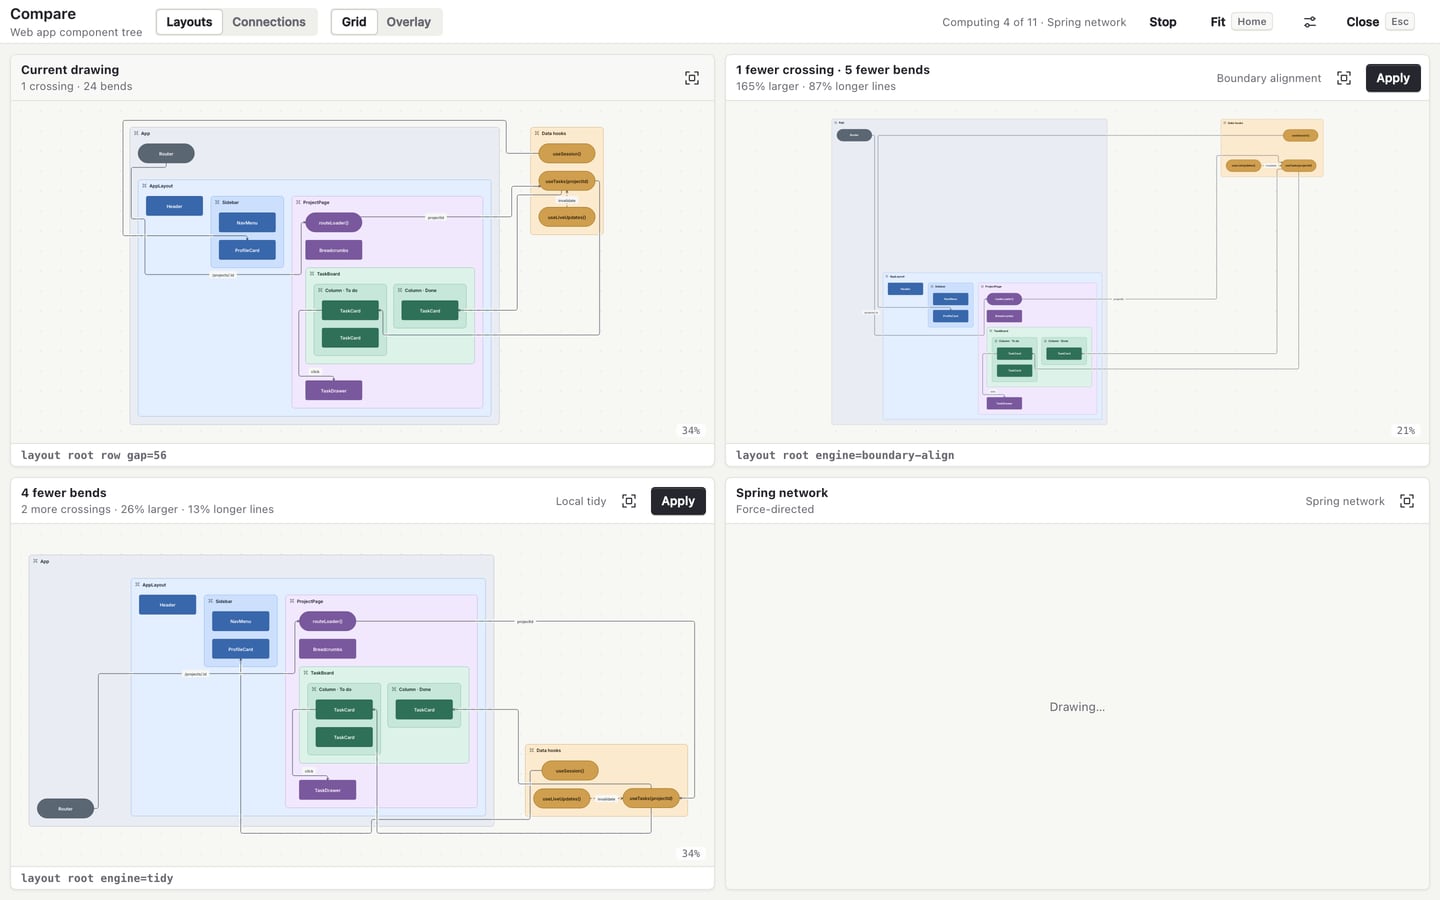
Two later changes made the sheet more trustworthy. The candidates are now computed in parallel (#392), and a candidate with a label collision ranks behind every clean one, even if it is smaller (#393).
Where the numbers stop
When Compare was rebuilt, an audit compared the measures against a visual judgment of the same pairs of drawings:
So the numbers and the eye disagree more than a third of the time. That is not a reason to drop the numbers. They are good at catching what you skim past: a new crossing, a warning, a canvas that doubled. They are bad at whether a diagram reads well.
That is why every tile and card shows the drawing, and why the rule only recommends changes that need no judgment. For an agent, the default works well. Run vary. If it recommends something, apply it. If it says v0, the remaining options are trades, so show a person the contact sheet. That is what happened with the loop diagram. The tool found the safe option and laid out the trades, and I made the call from the picture.