The tsx-dataflow browser was doing real work, but it did a bad job of proving that.
On a large project such as Pluck, the first page load can build a TypeScript program, index symbols across hundreds of source-file entries, trace render paths through the project, rank findings, and finally project all of that into page data. The old UI reduced that entire sequence to one line:
Loading analysis…
That is fine for two seconds. At 15 or 30 seconds, it becomes impossible to distinguish a slow analysis from a broken server.
The dev logs made the uncertainty worse. Saving a frontend file could produce Vite proxy errors such as ECONNRESET and ECONNREFUSED. Meanwhile the browser stayed on a loading state with no indication of whether the analyzer was running, restarting, queued, or stuck. The end result felt locked even when some part of the system was still making progress.
The hot-reload problem
The first issue was straightforward. The development command watched the entire src tree, including the Solid frontend. Vite already owns frontend hot module replacement, but the broad Node watcher also restarted the API server on the same save.
One frontend edit could therefore do two things at once:
- Vite refreshed the changed client module.
- The API process stopped and restarted underneath in-flight requests.
That explains the proxy failures. A request that was already connected saw ECONNRESET; the next request could arrive before port 4318 was listening again and see ECONNREFUSED.
The watcher now includes the analyzer and server source while excluding src/frontend/**. Frontend saves stay inside Vite. Backend changes still restart the API worker. GET requests also retry a small number of genuine proxy restart failures, which smooths over the remaining intentional backend reload window.
That fixed the unnecessary restarts, but it did not fix the locked page.
Why SSE was not enough
My first thought was the obvious one: add an SSE endpoint and send progress messages to the browser.
The problem was that the analyzer ran synchronously in the HTTP process. While TypeScript was building the program and the analyzer was tracing files, the Node event loop could not service another request. Even /healthz had to wait. An SSE connection might be open, but the server could not flush useful events while the work that generated them held the thread.
That is an important boundary. Progress reporting is not only a UI feature. The architecture has to leave some part of the application available to report progress.
The server now keeps HTTP and SSE in the main process and moves the analysis cache into a worker thread. API requests become messages to that worker. The worker owns the expensive TypeScript program, generation cache, file reports, and projections. It sends results back when an operation completes, but it can also send small progress events while it works.
This separation changed the behavior in two useful ways:
/healthz, static assets, and the SSE stream remain responsive during analysis.- Progress callbacks can sit inside the real file loops instead of estimating time from the outside.
The worker is what unlocked accurate reporting. Without it, the browser could know that a request had started. With it, the browser can know that symbol indexing is at 494 of 794 program-owned source entries and still receive the next update.
Reporting work the analyzer actually completed
The progress model follows the analyzer rather than inventing a percentage for the whole operation:
Build TypeScript program
Index symbols
Trace render paths
Rank and summarize findings
Prepare page data
Some phases expose a real denominator. Once project discovery resolves the configured files, program construction can report the source-file count. Identity indexing advances after each source file is visited. Render tracing advances when each eligible file finishes analysis.
Other phases do not have a useful internal unit yet. TypeScript's createProgram call is mostly opaque from this layer, and ranking is a collection of rollups rather than one clean file loop. Those stages still report active and complete states, but the UI does not pretend that an arbitrary animation is a measurement.
Here is a cold Pluck run while the worker is indexing symbols:
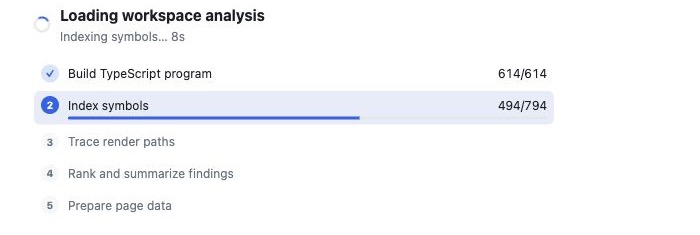
The screen now answers the questions I actually have during a slow load. Which phase is active? How much measurable work has completed? What already finished? What is still ahead?
Accumulating progress in the page
The client listens to /api/progress with EventSource. Each event carries the operation, phase, step, message, and optional completed, total, and file fields. The loading component retains the latest update for every step instead of replacing one status sentence over and over.
Completed steps get checkmarks. The active step gets a background and a determinate bar when counts exist. Future steps stay visible but quiet. Elapsed time remains in the heading because a count alone does not tell you how long the current project has taken.
Later in the same Pluck run, the program, identity index, and trace are all visibly complete while ranking is active:
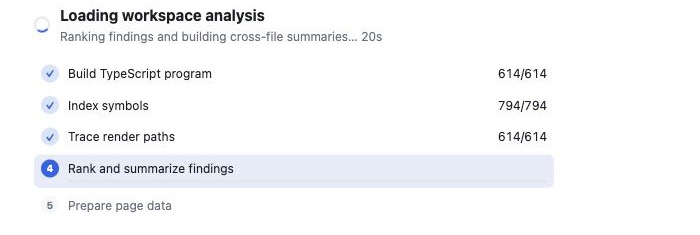
This is much better than a global spinner. The page has a small history of the operation, an active state, and a preview of what remains. It also works for explicit re-analysis, not only the initial resource load, so clicking Re-analyze no longer leaves the old page sitting there with one disabled button as the only evidence of activity.
The useful distinction
There are two different kinds of progress worth reporting:
- Liveness says the process has not disappeared.
- Measured progress says a known amount of work has completed.
SSE gave the browser a good liveness channel. Moving analysis into a worker kept that channel responsive. Instrumenting the analyzer's actual loops turned it into measured progress.
That combination is what made the page feel trustworthy. A long analysis can still be long. The difference is that 494/794 looks like work, while a spinner at 16 seconds looks like a question.
Source: byronwall/tsx-data-flow