I ran a complete production workflow through Find My AI Fit, opened the new admin dashboard, and saw zeros.
That was a useful failure. The public tool had accepted my profile, generated directions, built an opportunity grid, and produced a final execution brief. I knew the application had done real work. The analytics pane knew nothing about it.
The fix was partly plumbing, but the more interesting question was what the admin pane should prove once the plumbing worked. Request counts alone were not enough. I wanted to know whether people were moving through the product and what the tool was giving them at the end.
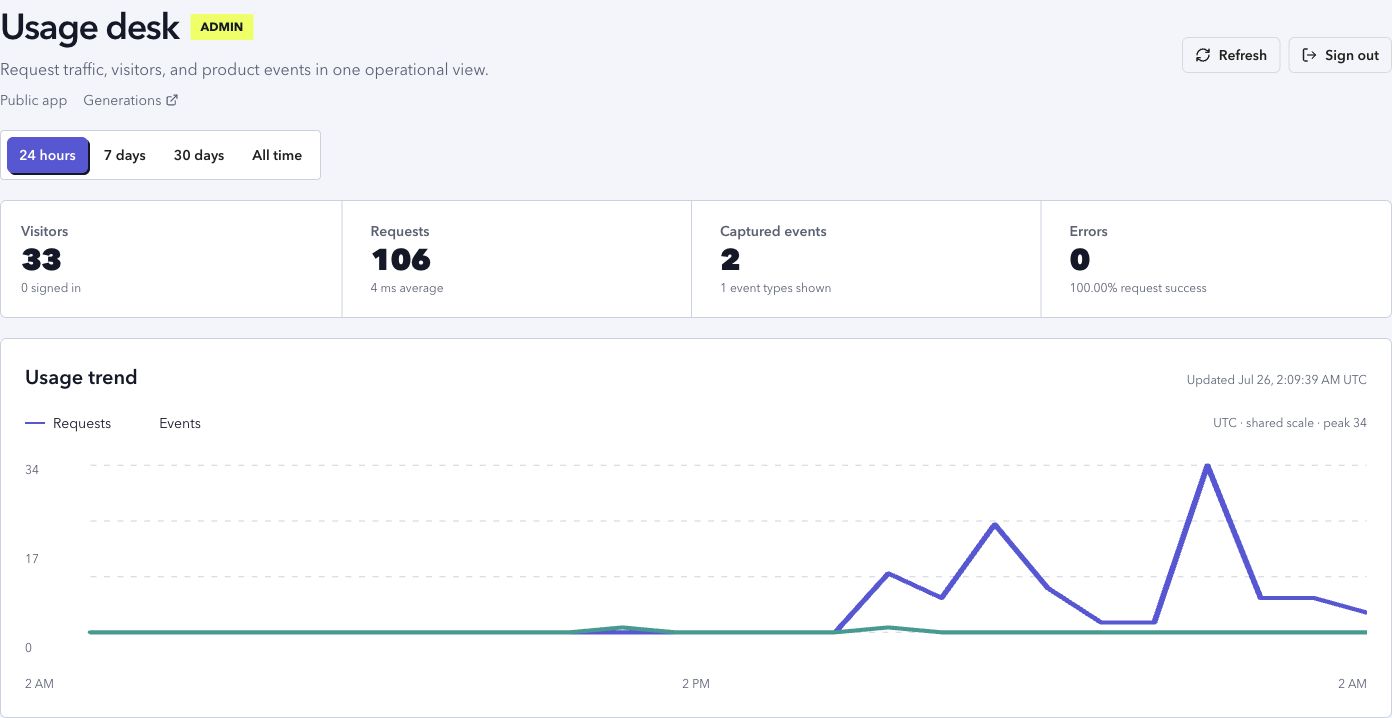
The admin pane I wanted
The first requirement was simple: keep the dashboard private without making it annoying to use.
The admin route reads a password from an environment variable. A successful login creates a signed, HttpOnly cookie that lasts for 30 days. The password stays out of the client bundle, and I do not have to re-enter it every time I check the site.
Behind that gate, the usage desk combines three different kinds of evidence:
requests
  -> is the site receiving traffic and responding correctly?

product events
  -> what actions are people taking inside the workflow?

generation records
  -> what did the tool actually generate?
Those layers answer different questions. Combining them in one operational view makes it much harder to confuse activity with useful product use.
Why the production dashboard was empty
The analytics code already existed. That made the empty dashboard more confusing than if nothing had been implemented.
There were three separate problems.
First, the request middleware was defined but not registered with SolidStart. The code looked plausible in isolation, but production requests never passed through it. There was nothing to persist because the capture layer was not connected to the application.
Second, the file-backed writes were allowed to continue after the response. That can appear to work during local development, where the process stays alive and the filesystem is nearby. In a deployed server, an unawaited write is not a durable contract. The response can finish before the record reaches disk.
Third, client events were sent to /api/events. Content blockers quite reasonably treat a route with that name as analytics. A visitor could use the product successfully while the browser silently blocked the event beacon.
The repair was direct:
- register the request middleware in the SolidStart server configuration
- await analytics persistence before completing the request
- send product events to the less filter-prone
/api/usageroute - use a keepalive request with
sendBeaconas the fallback
After deployment, the usage desk started showing traffic and events. More importantly, the records survived another deploy because the production data directory was already mounted as persistent storage.
Traffic is not the same as use
The first populated dashboard was a good reminder that public-site traffic is noisy.
It showed more than 100 requests and 30-plus visitor labels. The top paths included normal page loads, but also WordPress probes, environment-file probes, and other automated requests that had nothing to do with the product.
If I stopped at a visitor count, I could tell myself the site had meaningful reach. The event ledger told a different story: only a couple of actual product events had been captured.
Both observations are useful. The request layer tells me the deployment is reachable, how it is performing, and how much background noise it receives. The event layer gives a much narrower signal about intentional interaction.
This is why I like keeping the raw operational view close to the product view. A single top-line number hides the distinction.
Following a person through the generated result
Events still do not answer the question I care about most: what did someone get?
Find My AI Fit stores each model attempt as a separate generation record. A complete run usually leaves a sequence like this:
profile directions
  -> use-case grid
  -> execution brief
I added a Recent generated results section directly to the usage desk. Each row shows the generation type, status, session, round, model, start time, and runtime. Clicking a row opens a readable inspector.
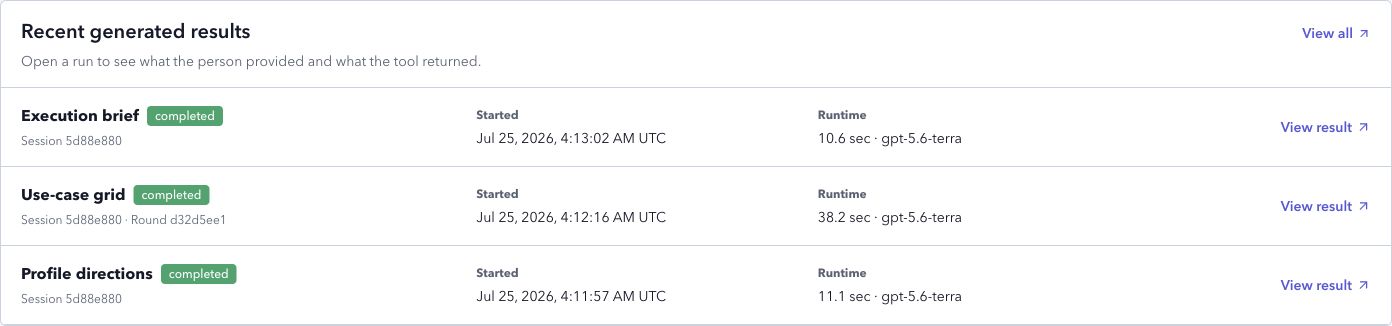
The inspector does more than dump JSON. It reconstructs the useful parts of the run:
- the profile summary, intent, and selected directions that shaped the request
- the generated opportunity titles and summaries
- refinement questions and choices for focused exploration
- the recommended first experiment from the final brief
- every ready-to-use prompt generated for the selected ideas
- timing, token use, finish reason, and the complete stored provider record
The readable result comes first. The full payload is still available through an expandable field explorer when I need to debug the model contract or inspect provider metadata.
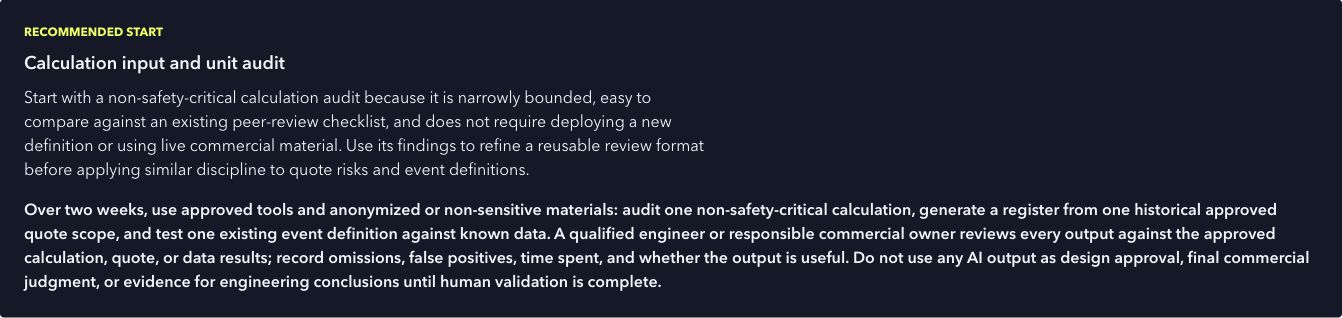
That ordering matters. Most of the time I am not asking, “What exact JSON did the model return?” I am asking, “What did this person appear to be trying to do, and was the result any good?”
Correlation without putting everything in the event log
It would be easy to copy prompts, profile details, and model outputs into the analytics store. I do not think that is a good default.
The event stream now carries opaque session and round IDs for new generation events. Those identifiers are enough to connect an interaction to the corresponding protected generation record. The analytics event stays small, while the more sensitive context remains behind the admin gate in the system that already owns it.
The uploaded PDF body is redacted from generation traces. The inspector can show the extracted profile context and the model result, but it does not need to retain another copy of the source document.
This is still an internal prototype with file-backed data, not a general-purpose analytics platform. If usage grows, the storage and identity model will need another pass. For the current scale, the important part is that the boundaries are visible.
What the admin pane gives me
Before this work, I could tell that the server was running and manually test the happy path. I could not answer basic product questions without opening files on the host.
Now I can check:
- whether real requests are reaching the current deployment
- which paths and product events are active
- whether errors or slow requests are accumulating
- how far a session progressed through the generation sequence
- what the person supplied as context
- what the tool returned
- whether the result looks specific and useful enough to justify the workflow
That last part is the real value.
Analytics for a small AI product does not need to begin with a large warehouse or a perfect funnel model. It needs to preserve enough evidence to answer the next product question. For Find My AI Fit, that means connecting operational traffic to human actions, then connecting those actions to the generated artifact a person actually received.
The useful default is probably:
capture the request
  -> record a small product event
  -> preserve the durable result
  -> make all three inspectable from one private place
Once that exists, a zero is informative, a spike can be questioned, and a complete run can be reviewed as a product experience rather than a pile of server logs.