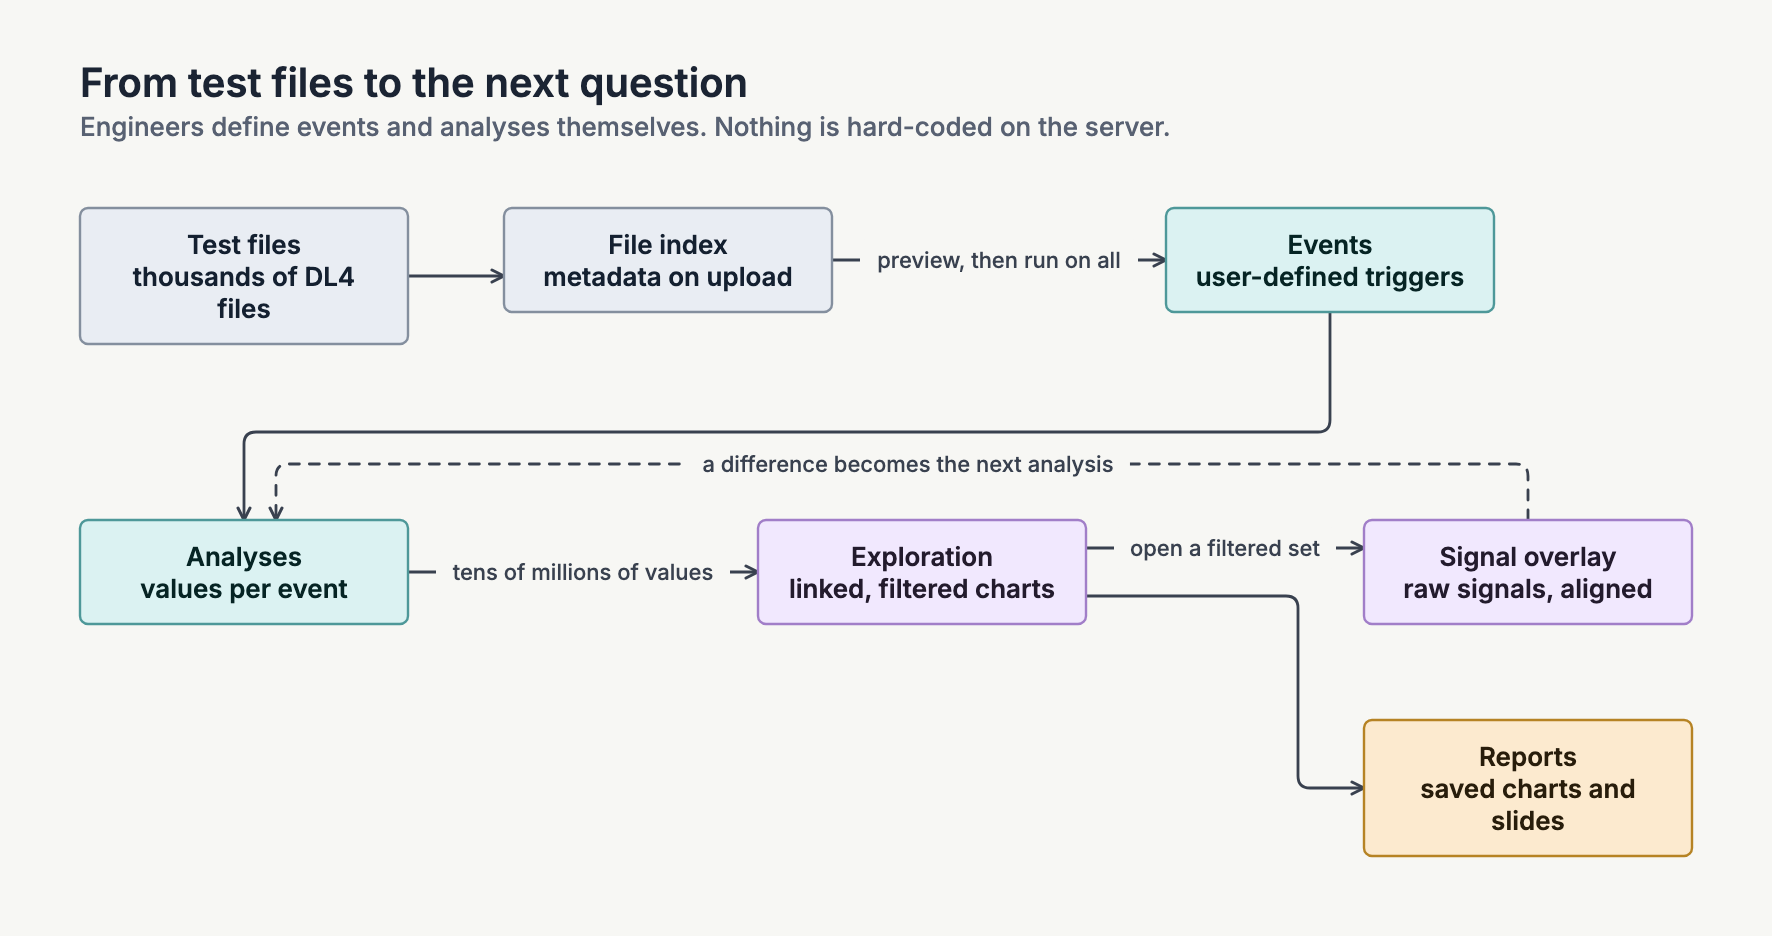
When I joined Allison Transmission, the data collection was strong and the data analysis was rudimentary. The internal data acquisition system logged the transmission controller and a wide range of analog sensors, at several thousand hertz when needed. You could run scripted tests and collect tons of data. But the files were in a proprietary format, and the only tool that could open them was the tool that wrote them. Most people analyzed a test by opening files and clicking around. Reports got built by hand in Excel and MATLAB, one test at a time.
At the end of a test you had a folder of files that were impenetrable. Getting from those files to an answer took hours of manual work, and the next question started that over.
Over about seven years I built the tool that fixed that. Internally it was called Shifty. I was the only developer and the product owner, so the decisions below were mine. It was internal software, so I have no screenshots.
Version one was a spreadsheet
The first version was Excel and VBA, and I had it working within about six months. It exported the relevant signals to CSV, pulled them into a workbook, smoothed them, and found the points of interest. For a hydraulic step test, say a solenoid stepped from 0 to 1.1 amps, it computed the response: maximum pressure, primary and secondary overshoot, how far it missed the pressure target. Then it did that for every test and compared across conditions, like overshoot against temperature.
It worked, and it was a lot better than clicking through files. But it was fiddly and slow, it lived on my machine, and only I could run it. Each analysis was its own spreadsheet, so improving one step of the pipeline meant porting the change across every workbook. It was a mess. It showed the analysis was possible, but it was only the start of a tool.
Next I fixed speed. I reverse-engineered the file format and wrote a C# reader for it, which Excel could call as an add-in. Now the pipeline could pull any signal straight from the files, much faster than going through CSV export. That reader ended up as the core parser of everything that came later.
But Excel was still the orchestration layer and the visualization surface, and it still only ran on my machine.

A web app with hard-coded analyses
The first web version moved the calculations into a C# server and the results into SQLite. The step-test analysis, for example, was hard-coded: you ran it, it stored the results, and the browser showed them.
Engineers made sense of the results in the browser, in a multivariate exploration view built on Crossfilter, and the key feature was that the user configured the charts at runtime. If your test varied temperature, engine speed, and cooler flow, you picked what to plot against what after the data was collected. You did not need to know your question before the test ran.
The problem was that every analysis lived in server code. If an engineer wanted something slightly different, or if I did, someone had to change C#, recompile, and rerun. It was more accessible than the spreadsheet, but every new question still came through me.
Letting engineers write the analysis
I fixed that with a small language. I built a DSL for the time series work that felt a lot like Excel formulas, and it ran as a pipeline in three steps.
- Files. You added test files and the system recorded their metadata.
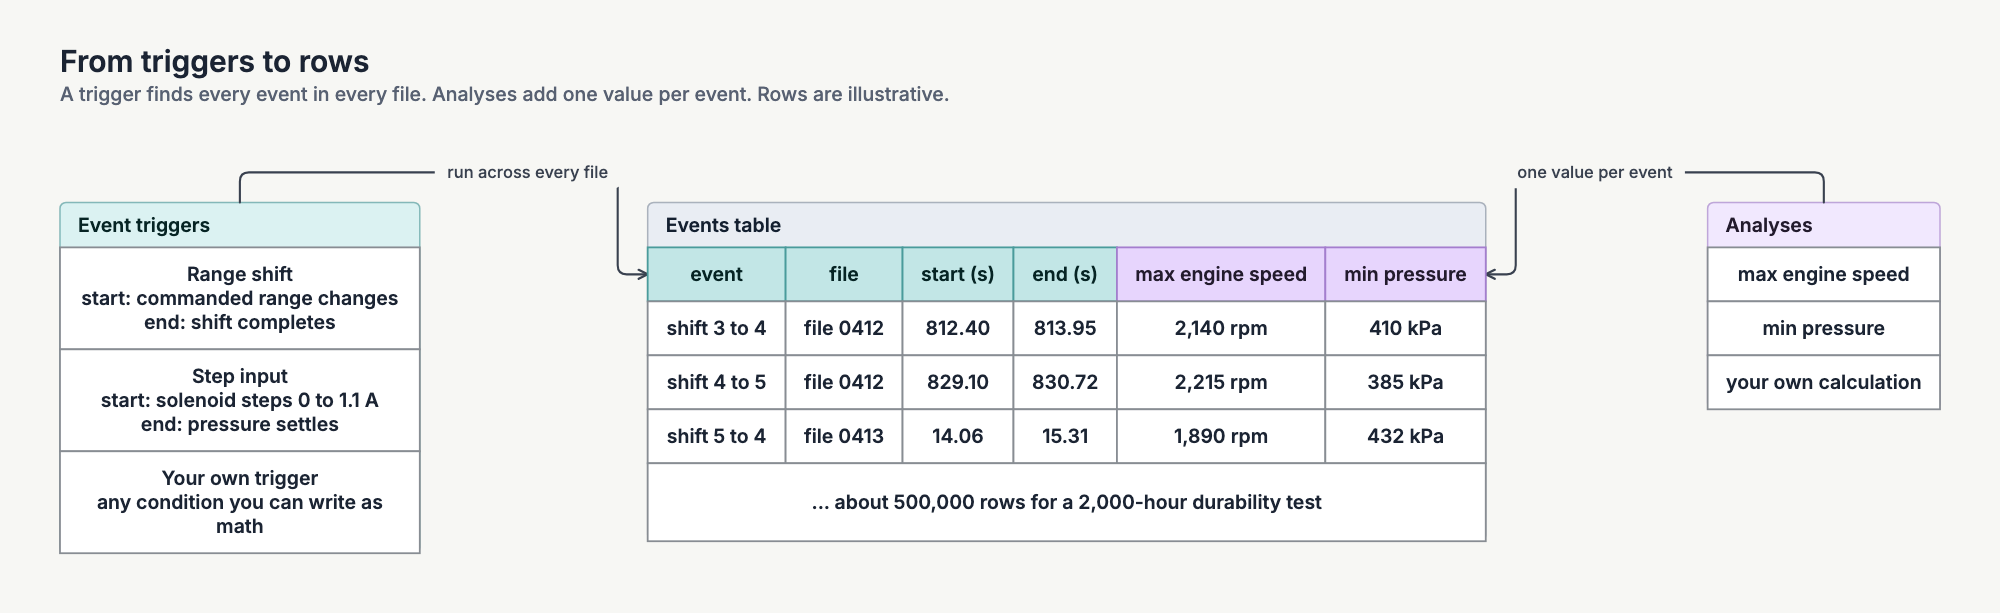
- Events. You defined an event, which works a lot like a trigger on an oscilloscope: when this condition happens, log a start and end time. Range shifts were the most common event, but an event could be anything you could describe with math and triggers. You previewed an event on a few sample files before running it across hundreds or tens of thousands.
- Analyses. For every event, you used the same language to compute values: maximum engine speed, minimum pressure, whatever you needed. You could compute anything, as long as the result was a scalar.
The standard example was a 2,000-hour durability test: about 10,000 files and somewhere between half a million and a million shifts. Finding every shift took around 12 hours, but at the end you had a database of every shift in the test. Add 10 to 30 values per shift and you have tens of millions of data points.
Then you worked the loop in the diagram at the top. In the linked charts you filtered down to a set of shifts that looked interesting. You opened an overlay of the raw signals for those events, aligned on the event start. Instead of paging through ten thousand files, you were looking at short snippets of the regions you cared about.
The overlay often gave you the next question. You would see that 300 ms after the shift command, some of the shifts did a bad thing and some did not. So you wrote a new analysis for that, ran it against whatever data you wanted, and went back to the charts. Once the charts looked right, you saved them and dropped them into a report.
I try to do this in most of what I build. I give people powerful software and let them define things, rather than compile every decision into the program.
The frontend got big
The frontend was React and TypeScript from the start, around 2018, and it grew to about 60,000 lines that I wrote from scratch. These are the parts I spent the most time on.
- Custom charts. The first version used dc.js on top of Crossfilter. Later I rewrote every chart as custom D3 code rendering SVG, and kept Crossfilter for the filtering. SVG handled the interactive parts. Scatter plots and parallel coordinates moved to Canvas where SVG got too slow. I designed the charts on purpose for fast interaction.
- A resizable chart grid. Users laid out a grid of charts and resized each one. Every chart had to render well at any size, so large charts showed more detail and small ones dropped things like axis labels to stay legible.
- Shared axes. Faceted scatter charts used shared axis limits by default, computed across every chart, and the user could override them.
- Deep links. You could link straight to an analysis result and send it to someone.
BlueprintJS covered the standard components, like buttons, menus, and dialogs. I wrote the rest.
Making it shared
Later I made the platform multi-user. Engineers worked in the same databases, built on each other's results, and reused each other's calculations. The C# server pushed changes to connected clients over WebSockets, and locks with first-write-wins handled concurrent edits. In my last year, around summer 2024, it moved to Windows servers in Azure, reading test data from network sources the servers could see.
When I left, engineering used it to analyze those test files. Usage telemetry showed more than 100 engineers using it. I recall that each week, 10 to 20 of them spent most of their workday in it, making sense of the test they had just run.
When I helped a team move their reporting pipeline onto it, their report work went from hours to minutes. That number comes from the conversions I worked on. I did not measure it across all users.
What I learned
Let people ask the next question themselves. With each version I removed a reason for people to ask me for a change. The spreadsheet needed me to run it. The first web app needed me to change server code. The DSL let engineers write the next analysis on their own.
Keep the raw data close. Aggregates and scalars are good for finding patterns, but they don't tell you why. To find out why, you had to look at the raw signals for the filtered set. The next analysis often started there.
Test the language. Once engineers were writing their own calculations, a refactor could change their answers without anyone noticing. I wrote tests that checked parsing, numerical results, and drift in results so I could keep changing the internals without changing anyone's numbers.
What I would change. If I rebuilt it today, the biggest change would be the parser. I knew of approaches that would have been much faster, but they needed a big rewrite and I never had the time. With coding agents, I think the code could also be a lot cleaner and much better tested, and the frontend could be easier to use and less noisy.
The public version
Shifty was internal and I can't show it. explorEDA is my open-source, clean-sheet take on the exploration side: an embeddable React workspace of linked charts that share one filter state, with the records behind every pattern a click away. It shares no code with Shifty, but it is the closest thing I can show to what the linked charts felt like.