I like debugging tools that make a hidden variable visible in the same place where the bug happens. The Pluck Structure Inventory had a pan-and-zoom problem: after a clean refresh, I could pan toward the top-right, watch new inventory items load, and then suddenly get reset back near the starting position.
At first it was not obvious whether the viewport was snapping, the item positions were moving, or the debug image itself was lying. The normal view was a fixed canvas: blue crop boxes arranged in space. The useful debugging move was to keep that spatial view, then encode time on top of it.
That is the Bret Victor-style ladder of abstraction part I like here. The product view is "where are the crops?" The debug view asks a higher-level question: "where did the viewport go over time?"
The first artifact was misleading
The initial debug export had the right intent, but the wrong evidence. It drew crop frames and a small movement trace, yet the trace collapsed into a thin dot or line even after moving around the canvas. That made the panning bug harder to diagnose because the artifact seemed to say "nothing much happened" while the screen clearly had moved.
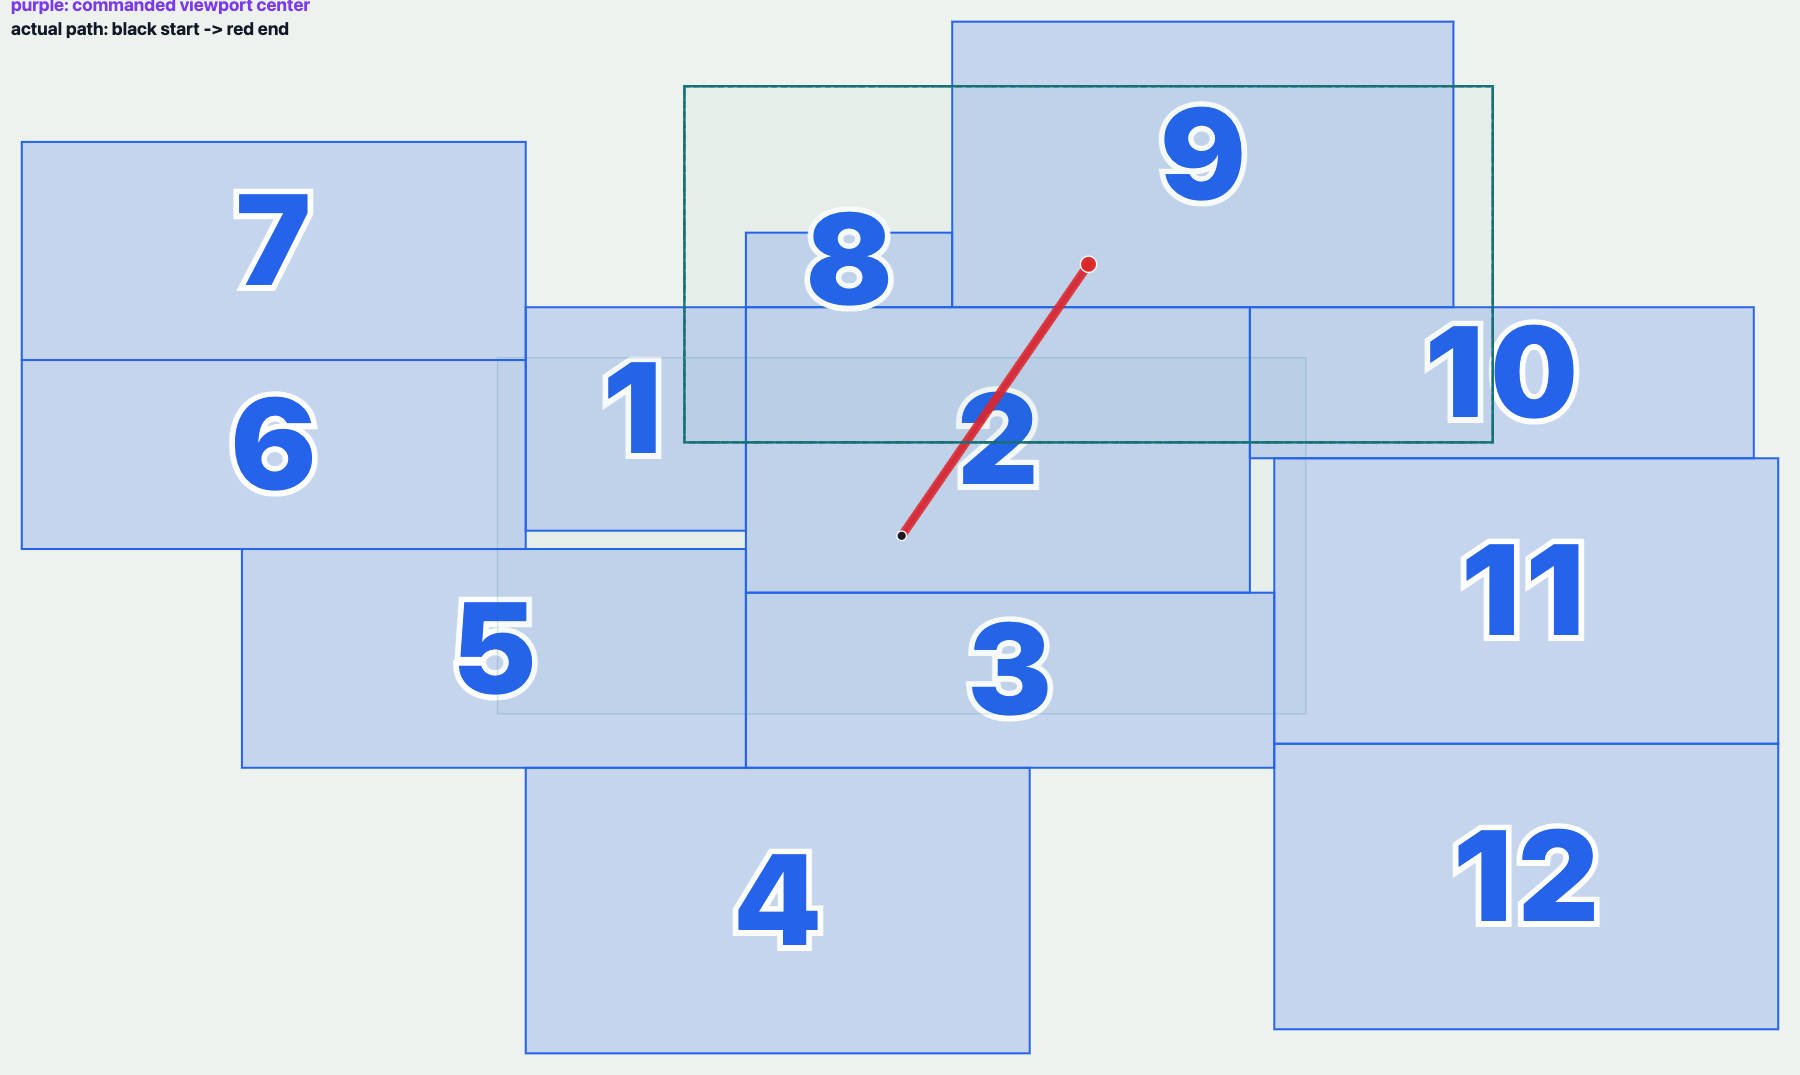
There were two related problems in the debugging layer.
First, the overlay was component-local state. Route query changes and remounts could silently turn it off. That is a terrible property for a diagnostic surface. If I am debugging a route-state or loading bug, the diagnostic should survive route-state and loading churn.
Second, the overlay was not reliably drawn in the same coordinate model as the canvas frames. The inventory canvas has a stage origin, pan offset, and zoom. A debug overlay that skips one of those transforms can look plausible in one state and completely wrong in another.
Encoding viewport history
The better version records viewport samples from the pan-and-zoom model itself. Each sample captures the commanded viewport, the committed viewport, and the rendered viewport. The export then draws:
- the crop frames as the spatial substrate
- a purple line for the commanded viewport center
- a black-to-red path for the rendered viewport center over time
- shaded viewport rectangles sampled along the way
- a final pair of rectangles for the latest commanded and rendered view
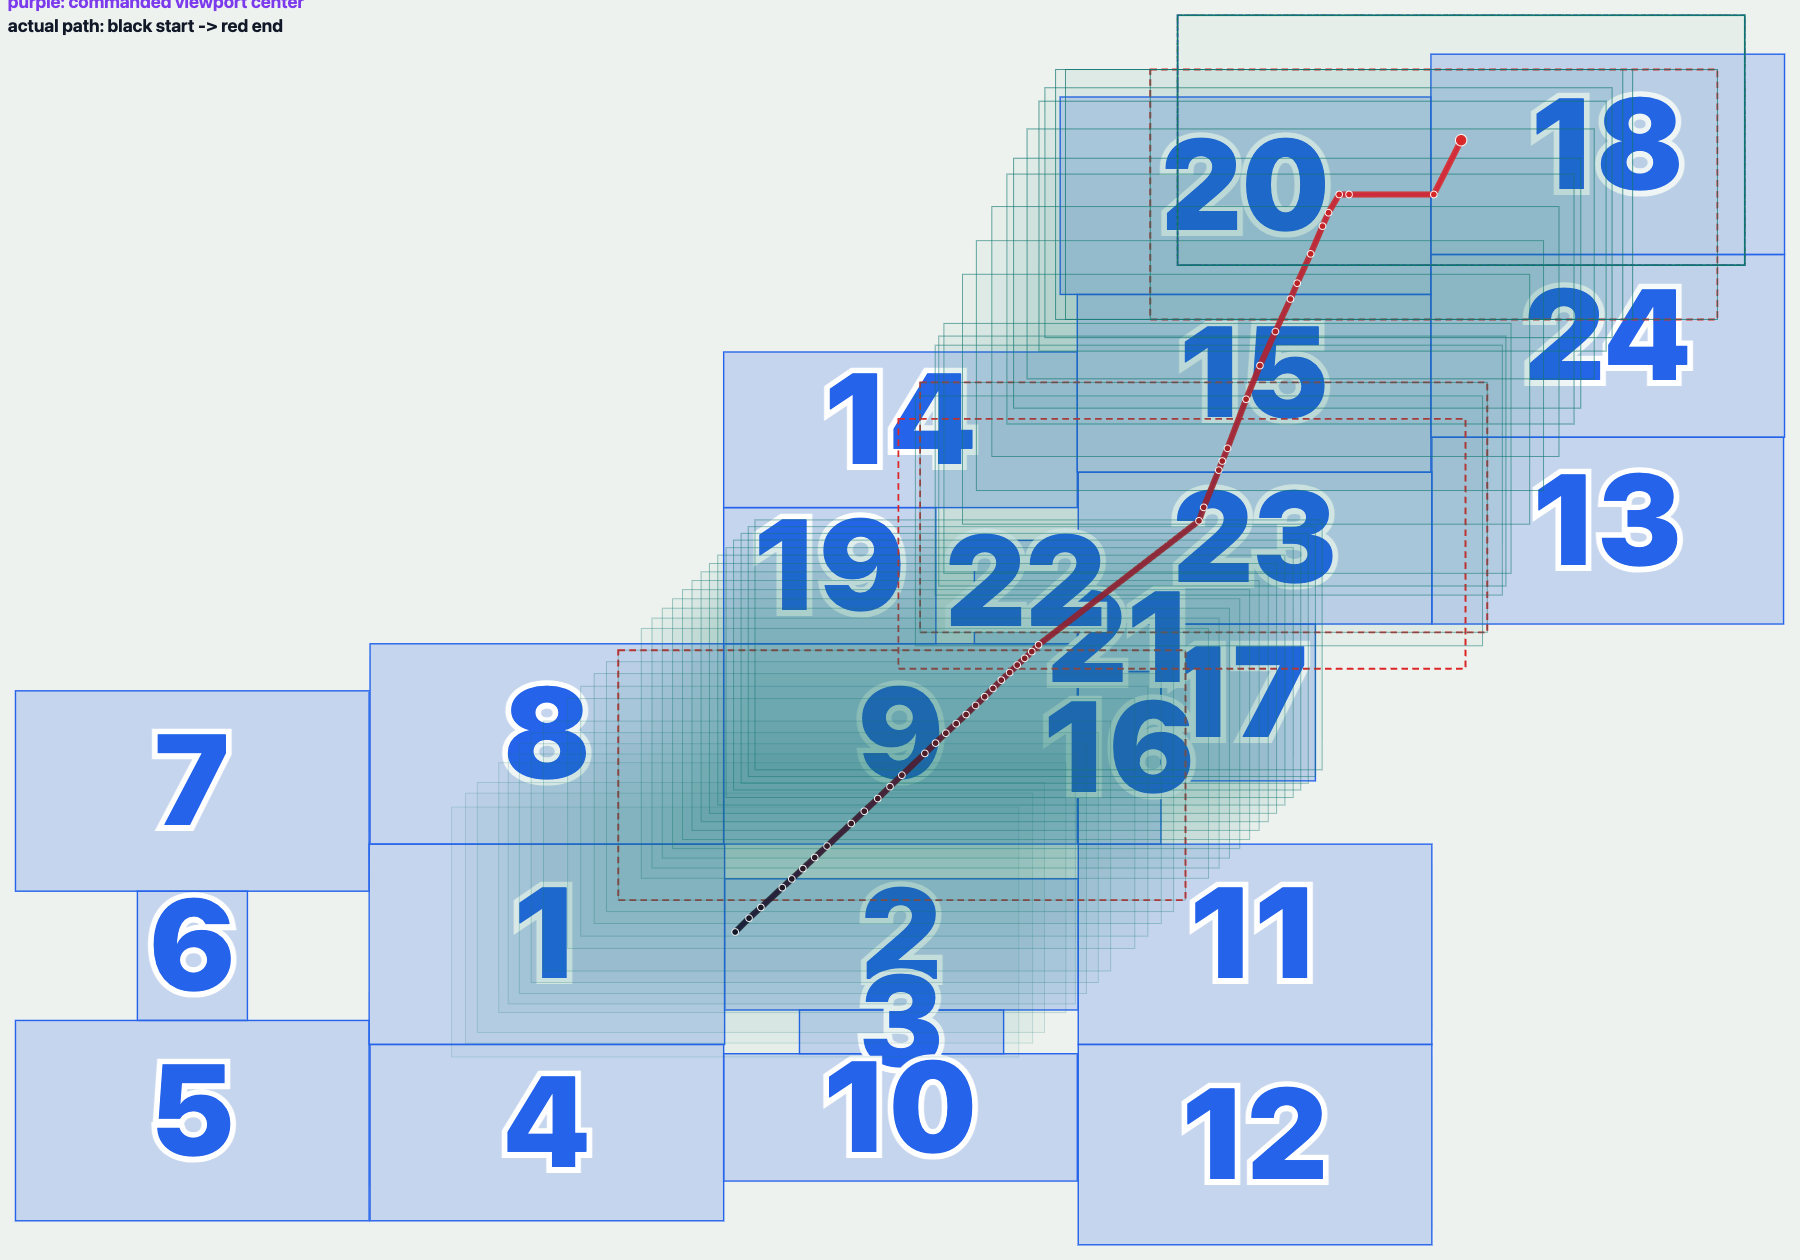
The canvas is still the canvas. The blue boxes still show the arranged inventory crops. But now time has a visual form. Instead of reading logs and trying to reconstruct movement, I can look at the export and see the path.
That matters because the bug was jarring. A bad crop placement algorithm might produce gradual drift: boxes would appear in surprising places, or the viewport would become empty at the edges. A viewport reset looks different. The path should have a discontinuity. The final position should disagree with the motion that led there.
Decode the video before guessing
The user report included a screen recording. I had to move it into the repo tmp/ folder because the agent process could not read the original Desktop path, then I decoded frames and made contact sheets.
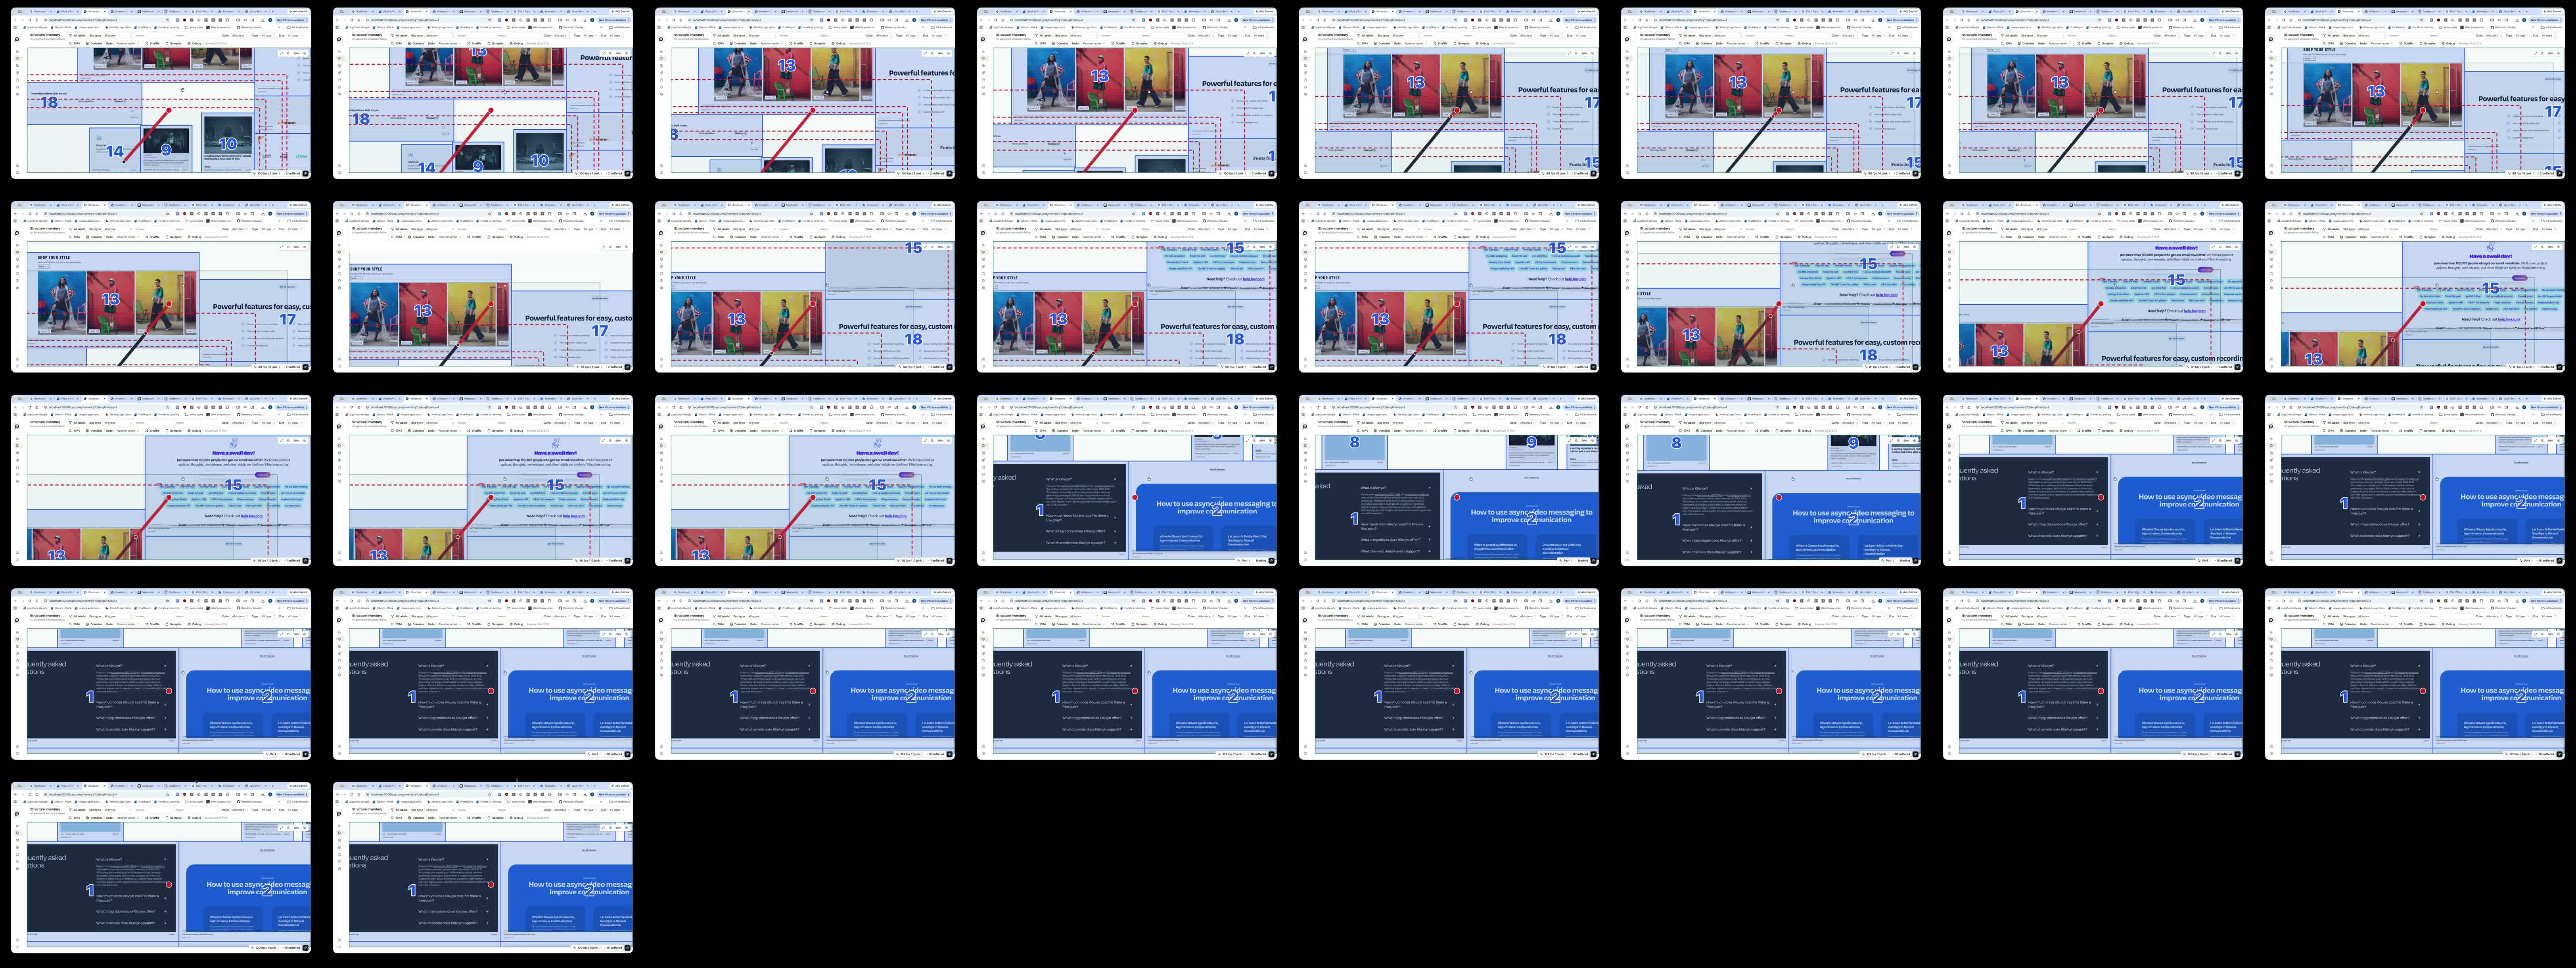
The video contact sheet changed the investigation. The reset was not a slow layout drift. Between adjacent sampled frames, the view jumped from a later top-right region back near the starting items. That pointed away from crop arrangement math and toward something reapplying the initial canvas focus.
Once the diagnostic trace existed, it also gave the browser smoke test a better fact to inspect. The page exposes recent samples on window.__pluckInventoryDiagnostics, and the footer can copy a report that includes the latest viewport trace:
viewportTrace #42 wheel-command
cmd(5237.5,46.9) render(5237.5,46.9)
dCmd(120.0,-18.2) dRender(120.0,-18.2)
jump false
The exact numbers are less important than the shape. A healthy pan has rendered movement that follows commanded movement. An uncommanded snap shows up as rendered movement without the corresponding command.
The actual bug was route timing
The root cause was not the overlay. The overlay just made the reset easier to see.
On a clean refresh, the inventory route could start in random order without a seed. Then onMount would generate the default random seed. That created a brief temporary world:
random:
Then the route would switch to the real seeded world:
random:<seed>
If the board mounted or the resource query ran during the temporary state, the pan-and-zoom surface could apply its initial focus once, then apply it again after the seed arrived and the placement identity changed. If the user had already started panning, that second initial focus felt like the page yanking the viewport back to the beginning.
The fix was to make that readiness explicit. The route now waits until the default random seed is available before issuing the real inventory query or mounting the interactive board:
const defaultRandomSeedReady = createMemo(() => {
  const currentOrder = parsedOrder();
  return currentOrder.mode !== "random" || Boolean(currentOrder.seed) || Boolean(defaultRandomSeed());
});

const queryKey = createMemo(() => {
  if (!defaultRandomSeedReady()) return null;
  return {
    limit: visibleLimit(),
    labels: filters().labels,
    order: order(),
  };
});
The canvas also gets an initial-view key tied to the placement identity, not whichever crop happens to be first while new items are being appended:
const initialViewKey = () => props.placementKey ?? "inventory";That separates two ideas that should not be coupled:
- a new arranged world should get an initial focus
- loading more items into the same world should preserve the current view
Making the diagnostic stable
The debugging tool got its own fixes because a diagnostic surface has to be more stable than the bug it is trying to explain.
The overlay state moved into the URL:
/captures/inventory?debugOverlay=1
That makes refreshes and route changes boring. If the URL says the overlay is on, it stays on.
The overlay is now rendered inside the same stage coordinate model as the inventory frames:
<Box
  position="absolute"
  pointerEvents="none"
  style={{
    left: `${-stageOrigin().x}px`,
    top: `${-stageOrigin().y}px`,
    width: `${canvasSize.width}px`,
    height: `${canvasSize.height}px`,
  }}
>
  {props.overlay}
</Box>
The canvas model records samples at the points where the viewport can change: wheel pan, drag pan, focus, zoom, resize clamp, and stage-origin adjustment. Each sample records both intent and rendered reality.
That distinction is the whole reason the debug image works. Commanded movement answers "what did the interaction ask for?" Rendered movement answers "what did the canvas actually do?" When those diverge, the bug has a shape.
Why this kind of debug visual is useful
This is more useful than a log because the bug is spatial. The question is not only "what changed?" It is "where did it change relative to the content?"
The viewport trace turns time into geometry:
- time becomes a path
- viewport size becomes shaded rectangles
- commanded and rendered state become comparable layers
- jumps become visible discontinuities
That is the abstraction ladder I want from debugging tools. The raw program state still exists, but the visual raises the level of the question. I do not have to mentally simulate pan offsets, scale, stage origins, crop frames, and resource timing. The export lets those variables meet on the canvas.
The practical result was a much faster fix. The video proved the reset was a hard refocus. The overlay proved whether the rendered viewport followed the commanded viewport. The route audit found a temporary random-seed identity. The final smoke test could pan while items loaded and confirm that the stage transform stayed stable instead of jumping back to the start.
I want more debugging tools like this: small, disposable visualizations that encode an internal variable directly into the product's native space. They are not polished product UI. They are thinking surfaces. And for canvas, capture, image, and layout bugs, a good thinking surface can cut through a lot of guessing.